Dollar index tops 100 for the first time since July as the Fed's hawkish dot plot sinks in

coverImg
Source: DepositPhotos

The U.S. dollar index pushed back above 100 on Wednesday for the first time since 31 July, extending a rally that began the moment the Federal Reserve delivered its first rate hike since 2023. The index was last at 100.05, up 0.06% on the session, having traded as low as 99.92 earlier. The move is not about the hike itself — it was more than 90% priced — but about everything that came with it: a dot plot showing 16 of 18 officials expect at least one more increase this year, and a median 2026 rate projection lifted to 4.1%.

From nine-week lows to 100 in eight days

The turnaround has been swift. As recently as 9 September, the dollar was languishing near 98.4 — nine-week lows — as markets doubted the Fed would follow through on tightening. Two forces flipped that narrative: a hot August retail sales report (+1.2% versus +0.8% expected) and a hawkish FOMC that left an October hike around a 50% probability on the table.

The scale of the repricing: swap markets now reflect more than 0.90 percentage points of additional tightening by the summer of 2027, and the move has been broad — every major currency is weaker against the dollar today.

Currency pairLevel (17 Sep, Asia session)Change
EUR/USD1.1461-0.66%
GBP/USD1.3371-0.76%
USD/JPY156.12+0.55%
AUD/USD0.7092-0.47%

The euro and pound are on the back foot ahead of the Bank of England's decision today (expected to hold at 3.75% with a 6-3 split), while the yen is drifting weaker even with a Bank of Japan hike to 1.25% — the highest policy rate in about 31 years — almost fully priced for tomorrow.
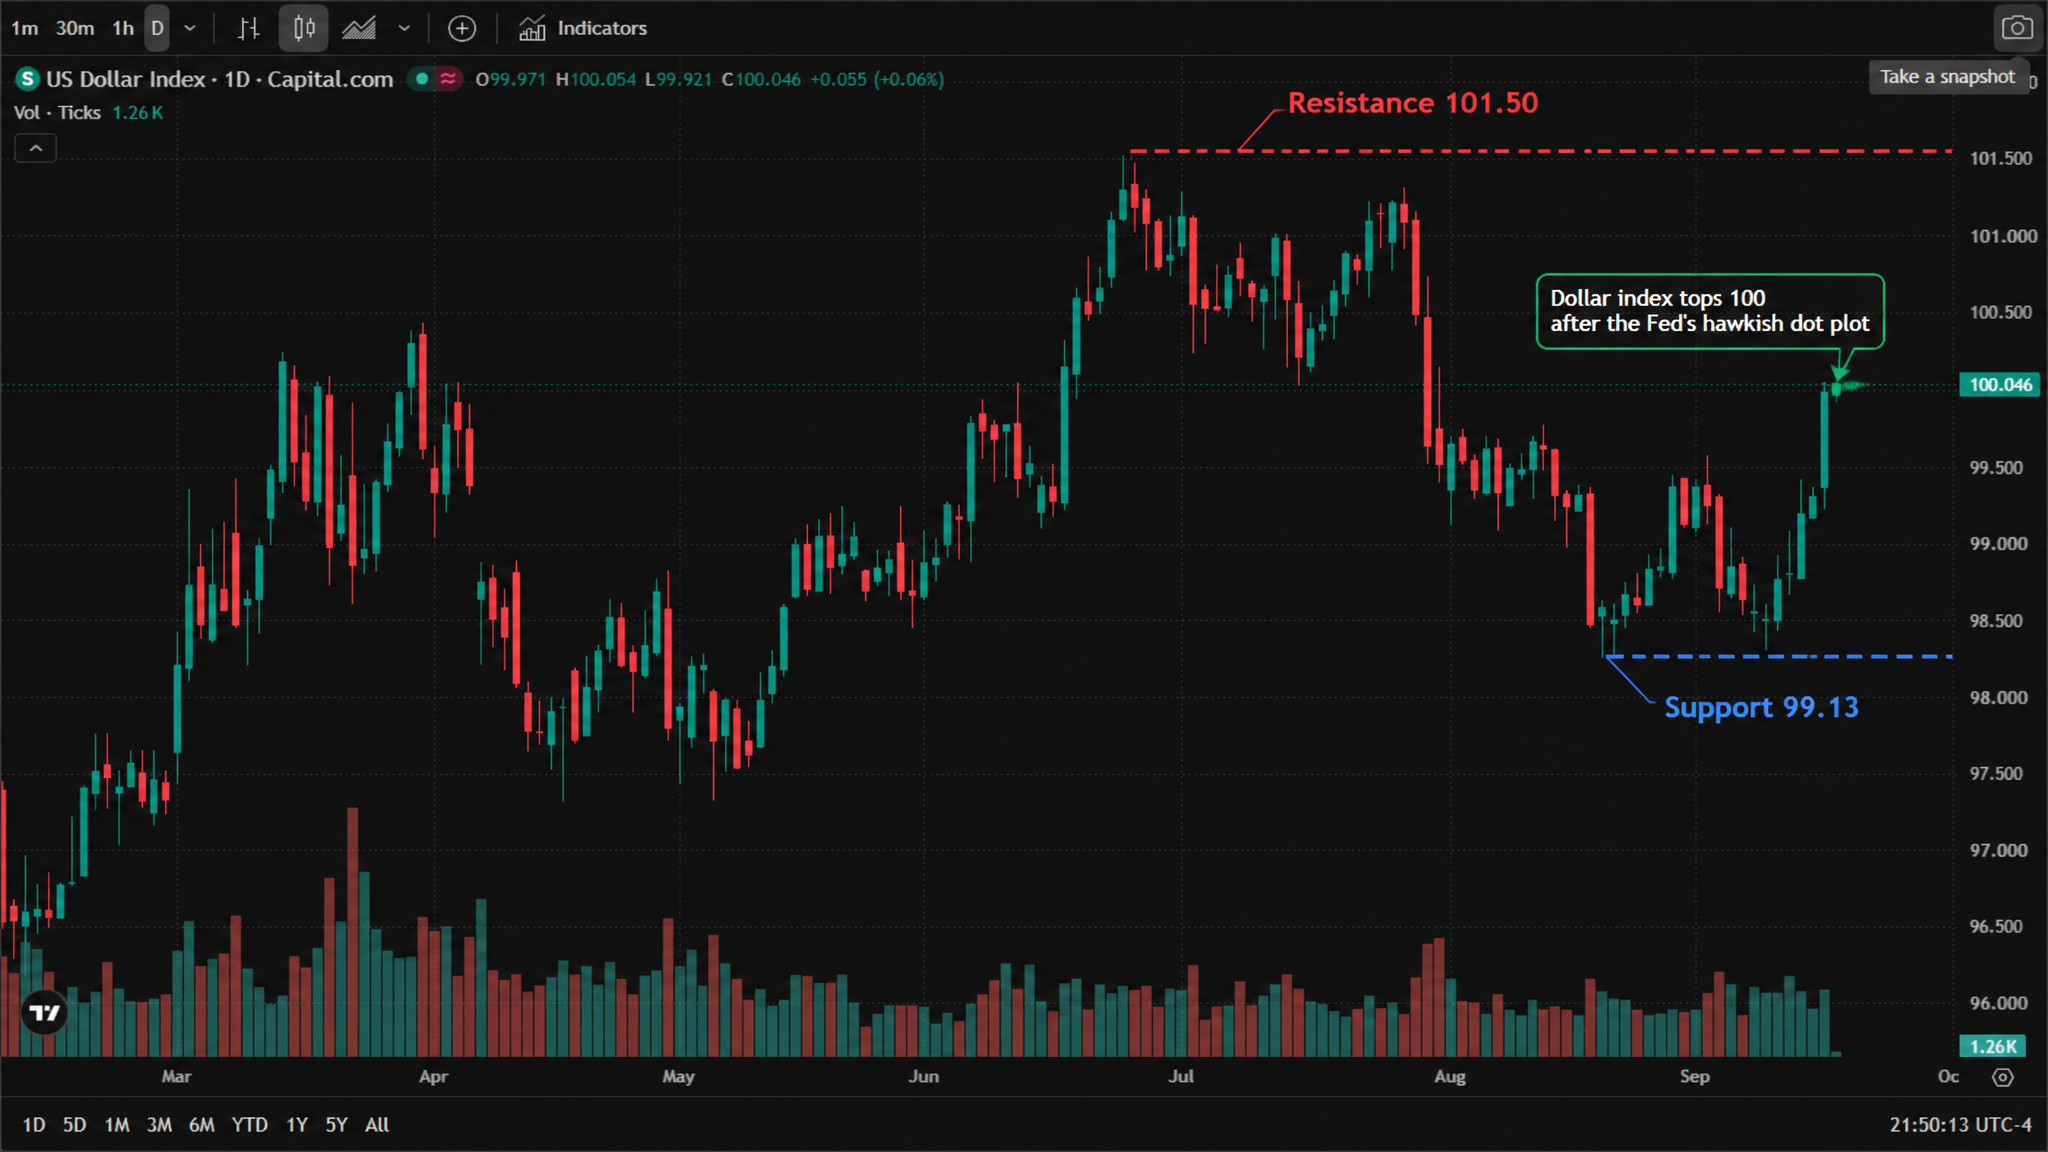
 U.S. Dollar Index daily chart (official TradingView chart screenshot, Capital.com data feed, real daily candles from February to September 2026) — the index rallied from below 97 in March to 100.5 in April, consolidated through May and June in the 98-99 area, spiked to a high near 101.5 in July, corrected back to 98.5 in August, then rebuilt its advance through September; as of 17 September 2026, 09:50 (New York time), the session opened at 99.971, reached a high of 100.054 and a low of 99.921, last at 100.046, up 0.055 (+0.06%) on the session. The annotated version adds "Support 99.13" and "Resistance 101.50" dashed lines and an arrow marking the breakout above 100.

* Chart source: official TradingView chart screenshot, Capital.com data feed (US Dollar Index), captured 17 September 2026, 09:50 am (New York time)

The rate backdrop: 10-year yields above 5%

The dollar's move is a yield story first. The 10-year Treasury yield closed at 5.027% — its highest zone since 2007 — while the 2-year punched to 4.736%, close to its 52-week high, and the 30-year sits at 5.361%. Fed Chair Kevin Warsh told reporters inflation is "too high and has been for too long," and the SEP showed PCE inflation at 3.7% for 2026 with a return to 2% pushed out to 2029.

That combination — higher-for-longer rates and no forward guidance — is exactly the mix that tends to keep the dollar bid.
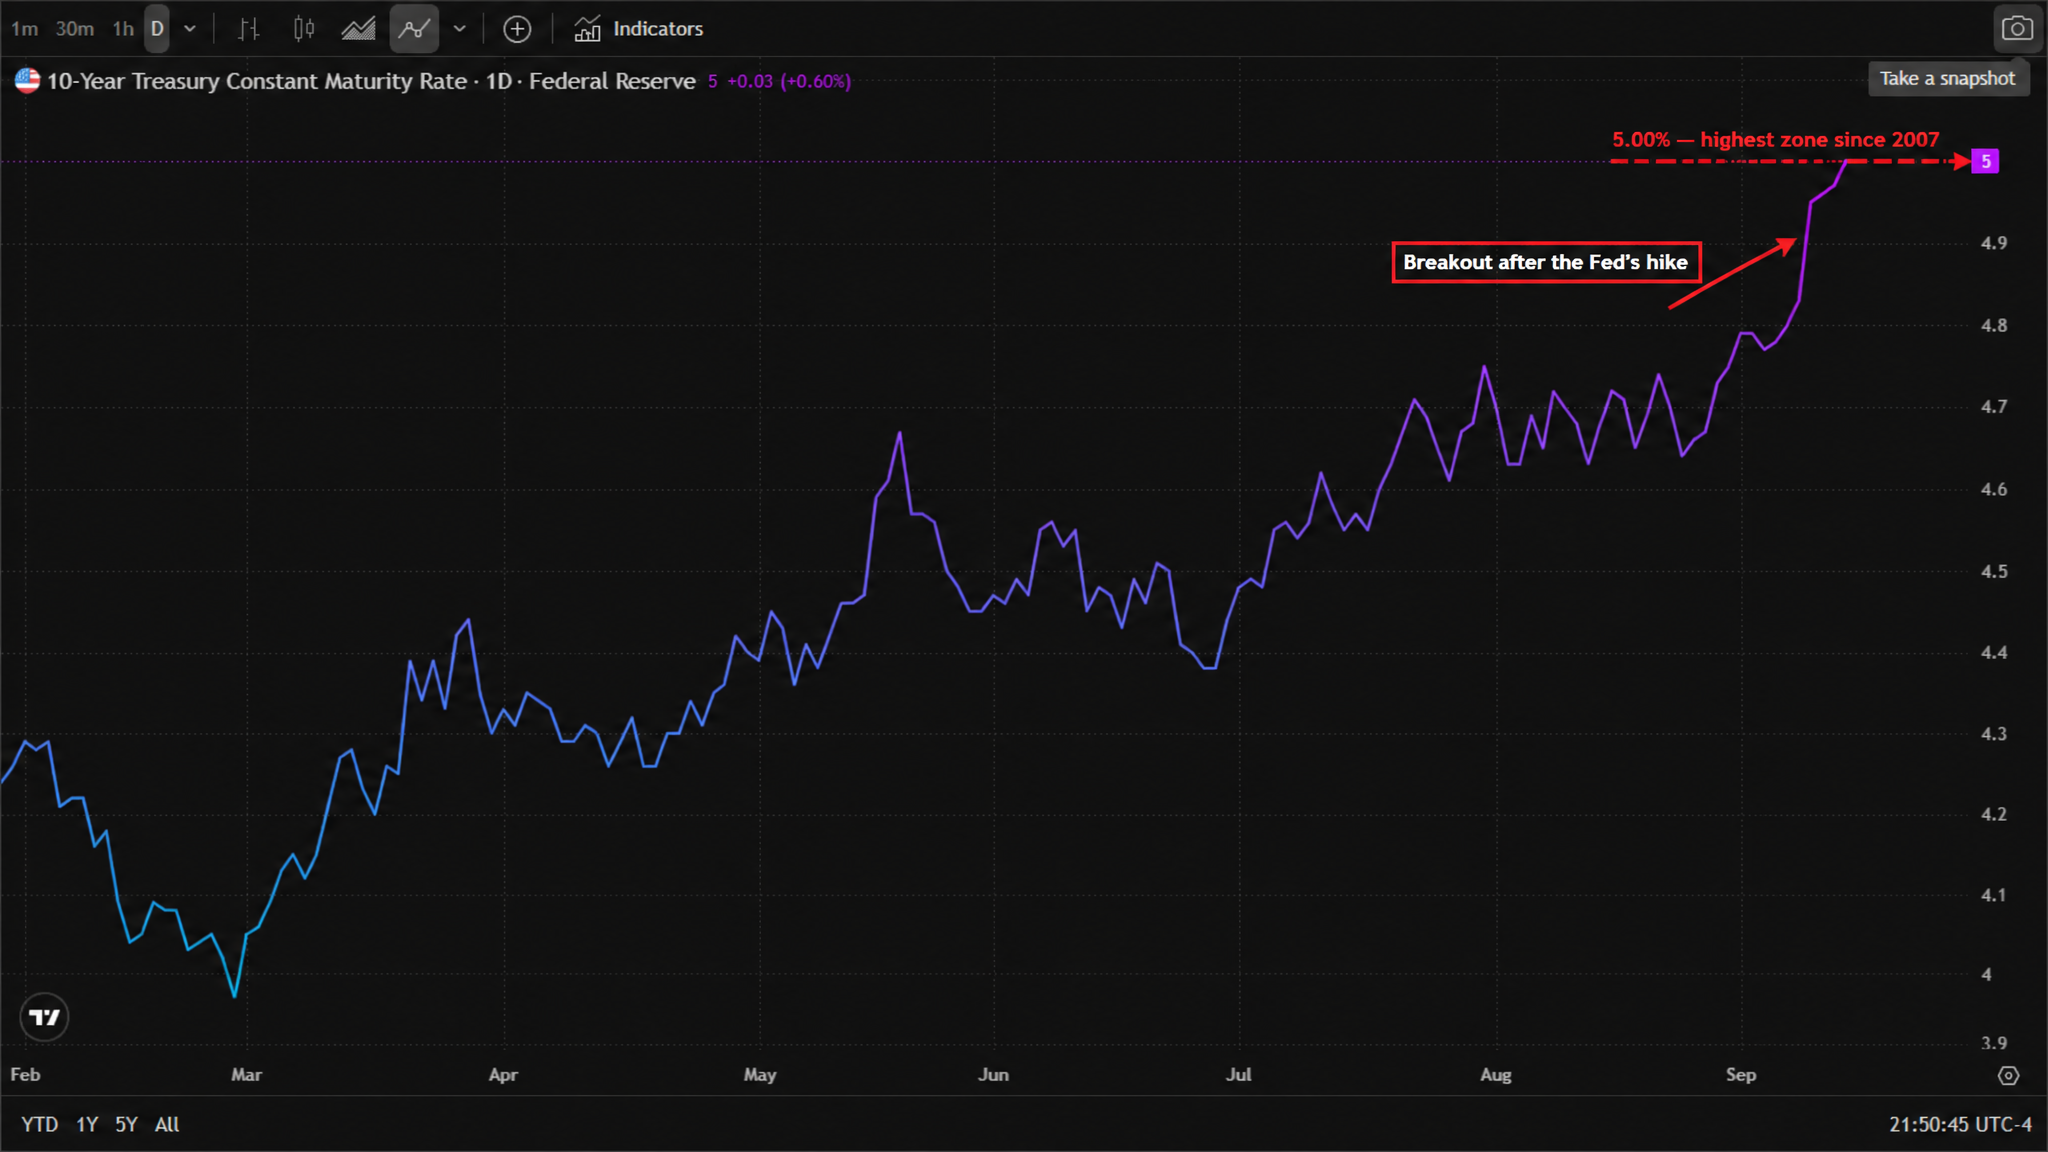
10-Year Treasury Constant Maturity Rate daily chart (official TradingView chart screenshot, Federal Reserve data, February to September 2026) — the yield bottomed near 3.95% in March, climbed to 4.7% by May, consolidated in the 4.4-4.6% range through June and July, then accelerated higher through August and September, breaking above 5.00% after the FOMC decision; last at 5.00% (+0.03, +0.60% on the session). The annotated version adds a "5.00% — the 2007 zone" dashed line and an arrow marking the post-Fed break above 5%.

* Chart source: official TradingView chart screenshot, Federal Reserve (FRED) data feed, captured 17 September 2026.

Technicals: 100.50 is the next test

The chart has flipped constructive, but the resistance stack above is dense. The index has cleared the 100-day moving average near 99.80 and the 50-day near 99.95, and the 200-day sits at 99.13 as first support. Above:

  • Resistance: 100.50, then 100.98, with 101.50 ~ 101.64 (the July high zone) as the bigger target;

  • Support: 99.13 (200-day average), then the 98.50 double-bottom zone — a decisive break below would invalidate the September recovery.

The debate now is how much follow-through the Fed can deliver. TD Securities argues the dollar rally extends only if the dot plot keeps an October hike alive — which it now does. Scotiabank cautions that with 90+ basis points of tightening already in swap prices, "any doubt about FOMC follow-through could derail the dollar." ING still sees the structural "debasement trade" as a headwind, but concedes the greenback could hold above 100 if data don't deteriorate.

What to watch

  • 12:00 London / 07:00 New York: the Bank of England decision — a hawkish hold at 3.75% would reinforce the "global tightening" theme and support the dollar;

  • 08:30 ET: US initial jobless claims (208K expected, 206K prior) — the first labour-market test since the hike;

  • Tomorrow: the Bank of Japan is expected to hike to 1.25%, the highest since 1995 — the yen's reaction will be the cleanest read on whether rate differentials or domestic tightening dominate;

  • Beyond: October FOMC odds sit near 50%, and Morgan Stanley expects hikes in December and March with a terminal rate of 4.25% ~ 4.5%.

Related reads: for the equities side of the Fed decision, see Dow drops 631 points as the Fed hikes; for the full set-up into this decision, see Fed hike odds near 90% into Wednesday's decision.

Read more

  • September Fed Rate Decision Preview: Is a Rate Hike a Foregone Conclusion? US Stocks, Dollar, and Gold Face a Critical Test
  • Silver breaks $64 as precious metals rebound — can gold hold the $4,280 line into the Fed decision?
  • Bitcoin falls below $75,000 as the CLARITY Act fails in the Senate — what the vote means for crypto
  • Gold falls below $4,300 as higher US yields bolster Fed rate hike bets
  • Bitcoin Falls Below $75,000, Crypto Stocks Plunge as Clarity Act Vote Fails
  • Note: If you want to share the article 《Dollar index tops 100 for the first time since July as the Fed's hawkish dot plot sinks in》, make sure you retain the original link. For more information, please visit Insights or browse www.mitrade.com.

    * The content presented above, whether from a third party or not, is considered as general advice only.  This article should not be construed as containing investment advice, investment recommendations, an offer of or solicitation for any transactions in financial instruments.

    goTop
    quote
    Related Articles
    placeholder
    TradingKey Daily Market Briefing: Fed Raises Rates by 25 Bps, May Hike Again This Year; Gold Tumbles as Intel Rises 4%On September 16, Eastern Time, US stocks rose before pulling back following the Federal Reserve's rate decision announcement for September. The Fed unanimously decid
    Author  TradingKey
    2 hours ago
    On September 16, Eastern Time, US stocks rose before pulling back following the Federal Reserve's rate decision announcement for September. The Fed unanimously decid
    placeholder
    September Fed Rate Decision Preview: Is a Rate Hike a Foregone Conclusion? US Stocks, Dollar, and Gold Face a Critical TestThe Federal Reserve will announce its September interest rate decision at 2:00 p.m. ET on Wednesday (September 16), followed by a press conference held by Fed Chair Kevin Warsh at 2:30 p.
    Author  TradingKey
    17 hours ago
    The Federal Reserve will announce its September interest rate decision at 2:00 p.m. ET on Wednesday (September 16), followed by a press conference held by Fed Chair Kevin Warsh at 2:30 p.
    placeholder
    【Daily Brief】10-year Treasury yield briefly tops 5%, S&P 500 slips to 7,602 and the dollar firms at 99.3 as the Fed's decision eve beginsThe 10-year Treasury yield touched 5.014% on Monday — its first print above 5% since October 2023 — while the S&P 500 closed 0.48% lower at 7,619.98 and the dollar index firmed to 99.3. Here is the full market wrap ahead of Wednesday's FOMC decision, the dot plot and the August retail sales report, plus today's CLARITY Act Senate vote.
    Author  Irene Q.
    Sep 15, Tue
    The 10-year Treasury yield touched 5.014% on Monday — its first print above 5% since October 2023 — while the S&P 500 closed 0.48% lower at 7,619.98 and the dollar index firmed to 99.3. Here is the full market wrap ahead of Wednesday's FOMC decision, the dot plot and the August retail sales report, plus today's CLARITY Act Senate vote.
    placeholder
    US August CPI lands tonight: after a 5.4% PPI shock, will the Fed hike on September 16?US August PPI came in at 5.4% year-on-year, above the 5.3% consensus, with core PPI at 4.6%. Traders have pushed the odds of a 25bp Fed hike on September 15-16 to around 70%. Tonight's CPI is the last major inflation print before the decision — here is the full calendar, the consensus numbers, and what a hot versus cool reading would mean for the dollar, yields, gold and stocks.
    Author  Irene Q.
    Sep 11, Fri
    US August PPI came in at 5.4% year-on-year, above the 5.3% consensus, with core PPI at 4.6%. Traders have pushed the odds of a 25bp Fed hike on September 15-16 to around 70%. Tonight's CPI is the last major inflation print before the decision — here is the full calendar, the consensus numbers, and what a hot versus cool reading would mean for the dollar, yields, gold and stocks.
    placeholder
    US August CPI Preview: Will Inflation Reaccelerate? US Stocks, Dollar and Gold Face Key Test On Friday, September 11 (ET), the U.S. Bureau of Labor Statistics will release the Consumer Price Index (CPI) for August, the final major inflation report before the Federal Reserve's Sep
    Author  TradingKey
    Sep 10, Thu
    On Friday, September 11 (ET), the U.S. Bureau of Labor Statistics will release the Consumer Price Index (CPI) for August, the final major inflation report before the Federal Reserve's Sep
    Live Quotes
    Name / SymbolChart% Change / Price
    USDOLLAR-F
    USDOLLAR-F
    0.00%0.00
    EURUSD
    EURUSD
    0.00%0.00

    USD Related Articles

    • Financial Markets 2026: Volatility Catalysts in Gold, Silver, Oil, and Blue-Chip Stocks—A CFD Trader's Outlook
    • Best Currency Pairs To Trade 2026: Guide to Choosing Currency Pairs
    • Trading Chart Patterns:Ultimate Guide to Price Action
    • Australian Dollar Forecast In 2024/2025/2026: Should I Buy AUD/USD Or Other AUD Currency Pairs?
    • AUD/USD holds above 0.6500, eyes on RBA Minutes

    Click to view more