

BNB (BNBUSD) Is up 1.06% on Sep 23: Why It Happened

Source Tradingkey

BNB (BNBUSD) is up 1.06% at Sep 23 23:00(ET), now at $791.2, with a 7-day up of 10.10%.
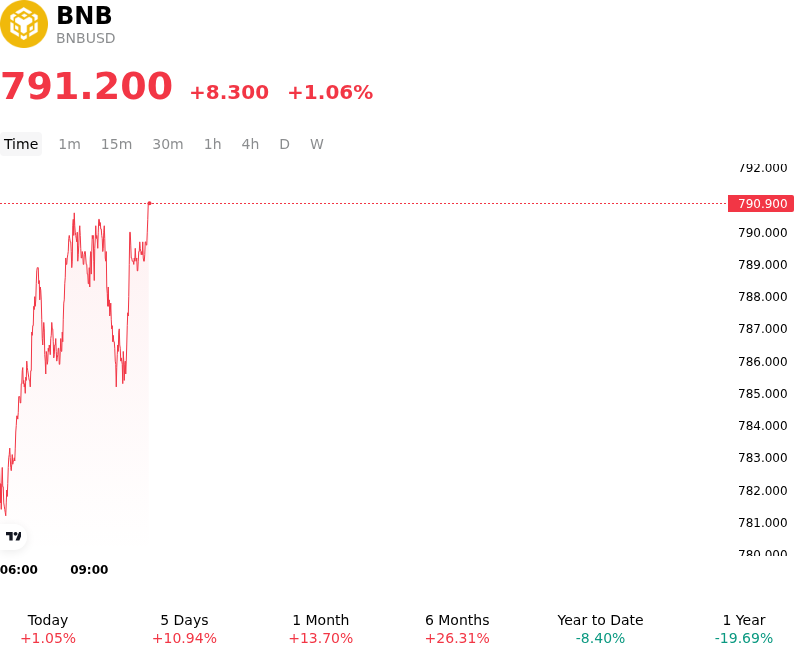
SummaryOverview

What is driving BNB (BNBUSD)’s stock price up today?

Capital flows into BNB reflect a combination of broader macro liquidity tailwinds and asset-specific fundamental strength across the Binance ecosystem. Following recent Federal Reserve monetary policy adjustments, easing financial conditions have enhanced global risk sentiment, prompting institutional and spot capital rotation into high-liquidity, large-cap altcoins. BNB has captured a meaningful share of these inflows, supported by elevated trading demand and solidifying its role as a core infrastructure token within the digital asset market.

A central driver behind this constructive price performance is the accelerating adoption of real-world asset tokenization and enterprise infrastructure on BNB Chain. Regulatory clarity surrounding tokenized stock trading and institutional asset issuance has positioned BNB Chain as a leading network for enterprise-grade tokenization. Institutional deployments, such as Ondo Finance's stock tokenization framework, alongside strong leadership in on-chain payout transaction volumes, have substantially broadened the network's fundamental utility. These developments reinforce long-term network demand for BNB as transaction fees, staking requirements, and ecosystem governance remain tied to chain utilization.

On-chain dynamics and derivative market positioning have further supported market liquidity. Recent technical enhancements, including network upgrades that reduced block times and lowered transaction fees, have improved execution efficiency for decentralized finance and automated trading strategies. Concurrently, expanded derivative coverage across perpetual markets has deepened market liquidity and facilitated institutional hedging, allowing the asset to absorb intraday profit-taking while maintaining structural support above key technical thresholds.

While the immediate upward movement reflects sustained institutional interest and ecosystem expansion, market participants continue to monitor several critical risk factors. Ongoing regulatory oversight of global trading platforms, potential shifts in macroeconomic liquidity, and leverage concentration within the derivatives market remain key variables. Overall, the price action reflects a structural trend grounded in expanding real-world asset integration rather than a purely speculative event-driven surge.

Technical Analysis of BNB (BNBUSD)

Technically, BNB (BNBUSD) shows a MACD (12,26,9) value of 6.917, indicating a buy signal. The RSI at 66.914 suggests neutral condition and the Williams %R at 15.125 suggests overbought condition. Please monitor closely.
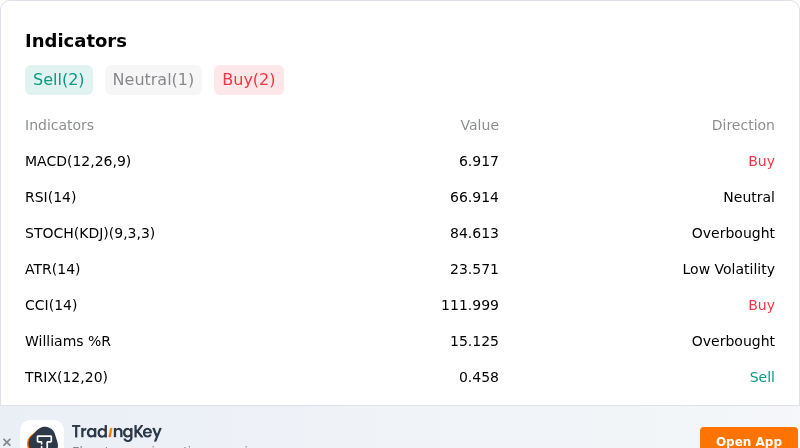
IndicatorAnalysis

More details about BNB (BNBUSD)

Recent Events and Risks:

  • Regulatory Scrutiny and Enforcement Exposure: Heightened regulatory oversight and reports regarding active federal investigations into compliance and sanctions practices continue to weigh on investor sentiment, creating persistent downside tailwinds for the exchange-linked token.
  • Technical Rejection at Psychological Thresholds: After failing to sustain price action above the psychological $800 level, BNB faced immediate profit-taking near major technical resistance at $823, raising the risk of a deeper retreat toward lower support targets around $750.
  • Derivatives Leverage and Liquidation Risk: Densely clustered leveraged long positions near immediate consolidation levels leave the market susceptible to cascading liquidations and heightened intraday volatility if key support levels fail to hold.
  • Ecosystem Outflows and On-Chain Capital Rotation: On-chain metrics reveal negative net flows for BNB Chain as liquidity rotates into competing Layer-2 networks, weighing on decentralized exchange volumes and spot demand for the underlying token.
Disclaimer: For information purposes only. Past performance is not indicative of future results.
placeholder
Bitcoin falls below $75,000 as the CLARITY Act fails in the Senate — what the vote means for cryptoThe US Senate blocked the Digital Asset Market CLARITY Act in a 49-50 procedural vote, sending Bitcoin briefly below $75,000 — its biggest one-day drop since June. Ethereum fell more than 8%, Coinbase slid 10% and $75 billion of crypto market value evaporated. Here is what the vote was, why it failed, and the levels that matter now.
Author  Suzie
Sep 16, Wed
The US Senate blocked the Digital Asset Market CLARITY Act in a 49-50 procedural vote, sending Bitcoin briefly below $75,000 — its biggest one-day drop since June. Ethereum fell more than 8%, Coinbase slid 10% and $75 billion of crypto market value evaporated. Here is what the vote was, why it failed, and the levels that matter now.
placeholder
Dollar index tops 100 for the first time since July as the Fed's hawkish dot plot sinks inThe U.S. dollar index broke back above 100 for the first time since 31 July after the Fed delivered its first rate hike since 2023, with the dot plot showing 16 of 18 officials expect at least one more increase this year. Here are the levels that matter for DXY, the currencies feeling it most, and what to watch next.
Author  Irene Q.
Sep 17, Thu
The U.S. dollar index broke back above 100 for the first time since 31 July after the Fed delivered its first rate hike since 2023, with the dot plot showing 16 of 18 officials expect at least one more increase this year. Here are the levels that matter for DXY, the currencies feeling it most, and what to watch next.
placeholder
Gold ends three-week slide at the $4,400 line — eight straight days of ETF inflows vs a 5% 10-year and a 100 dollarSpot gold closed Friday at $4,378.39, up 0.84% on the day and about 0.8% for the week — its first weekly gain in four weeks — with the intraday high of $4,399.67 leaving it 33 cents shy of the $4,400 line. Gold ETFs have now logged eight straight sessions of inflows, but with the 10-year back above 5% and the dollar index near 100, here is what decides whether this is a reversal or a bounce.
Author  Suzie
Sep 20, Sun
Spot gold closed Friday at $4,378.39, up 0.84% on the day and about 0.8% for the week — its first weekly gain in four weeks — with the intraday high of $4,399.67 leaving it 33 cents shy of the $4,400 line. Gold ETFs have now logged eight straight sessions of inflows, but with the 10-year back above 5% and the dollar index near 100, here is what decides whether this is a reversal or a bounce.
placeholder
Bitcoin rallies near $86K on improving markets ahead of quarterly options expiryBitcoin (BTC) market conditions improved over the past week as spot buying pressure strengthened and derivatives positioning increased, pushing the top crypto near $86,000.
Author  FXStreet
Yesterday 01: 16
Bitcoin (BTC) market conditions improved over the past week as spot buying pressure strengthened and derivatives positioning increased, pushing the top crypto near $86,000.
placeholder
Dollar holds above 100 near a 3-month high — three Fed speakers and a $69 billion auction land tonightThe dollar index closed at 100.43 on Monday, its highest close since late July, after a weekly gain of about 1% — the best in more than three months — and is holding above the 100.00 handle in Asia. Three Fed officials speak tonight alongside a $69 billion two-year note auction, the first leg of $183 billion of Treasury supply this week.
Author  Suzie
Yesterday 06: 34
The dollar index closed at 100.43 on Monday, its highest close since late July, after a weekly gain of about 1% — the best in more than three months — and is holding above the 100.00 handle in Asia. Three Fed officials speak tonight alongside a $69 billion two-year note auction, the first leg of $183 billion of Treasury supply this week.
goTop
quote