


BNB (BNBUSD) Suddenly Goes down 1.02% on Aug 16: What You Need to Watch
BNB (BNBUSD) is down 1.02% at Aug 16 02:25(ET), now at $602.4, with a 7-day down of 0.59%.
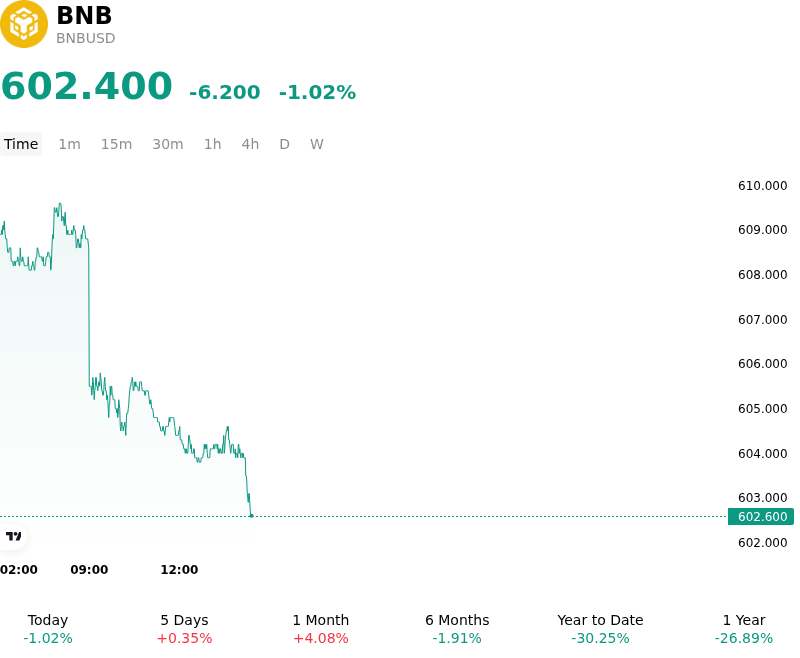
What is driving BNB (BNBUSD)’s stock price down today?
The pullback in BNBUSD reflects a broader soft trend across major digital assets, driven by thin weekend trading liquidity, persistent macroeconomic caution, and localized technical resistance. Market participants across the digital asset space remained hesitant to expand risk exposure, as broader digital asset liquidity remained subdued and spot trading activity stagnated. With major benchmark assets trading in tight ranges, utility and ecosystem tokens such as BNB faced modest selling pressure in the absence of fresh capital inflows.
Macroeconomic conditions continue to exert a constraining effect on digital asset valuations. A steady US dollar and elevated Treasury yield environment, combined with ongoing expectations that the Federal Reserve will maintain a restrictive policy stance, have limited liquidity expansion into risk assets. Furthermore, broader crypto market sentiment faced headwinds from corporate treasury rebalancing, including recent spot sales from major institutional holders, alongside regulatory uncertainty stemming from delayed SEC guidance on tokenization projects. These factors combined to keep institutional risk appetite muted, preventing sustained buying pressure across major altcoins.
From a market structure and derivatives perspective, reduced leverage and declining trading volumes contributed to the downside movement. A minor flush of long positions across derivatives venues triggered localized selling, while open interest growth remained flat. Although long-term fundamental drivers for BNB—such as ongoing quarterly supply burns and upcoming network performance upgrades like the Pasteur hard fork on BNB Chain—provide a structural valuation floor, immediate market positioning remains capped by key overhead technical resistance levels.
Ultimately, the intraday weakness in BNBUSD represents a liquidity-driven consolidation rather than a fundamental shift in ecosystem performance. Investors continue to monitor broader macroeconomic signals, Federal Reserve interest rate expectations, and market-wide liquidity flows ahead of upcoming regulatory and protocol events to assess whether current price levels offer a base for accumulation or remain susceptible to further range-bound pressure.
Technical Analysis of BNB (BNBUSD)
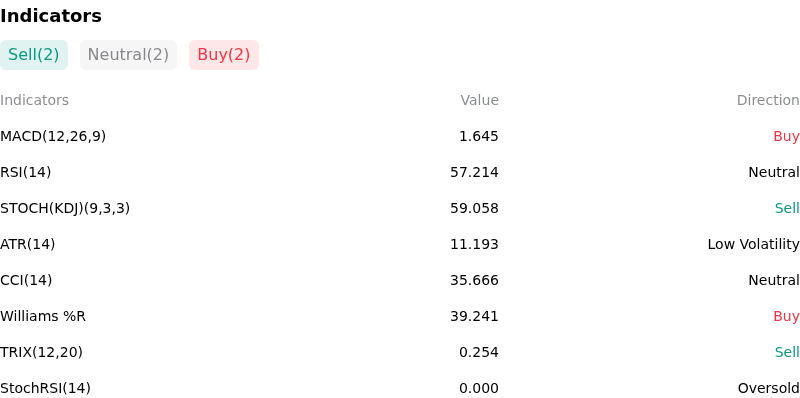
Technically, BNB (BNBUSD) shows a MACD (12,26,9) value of 1.645, indicating a buy signal. The RSI at 57.214 suggests neutral condition and the Williams %R at 39.241 suggests buy condition. Please monitor closely.
More details about BNB (BNBUSD)
Recent Events and Risks:
- Exchange Compliance Restrictions and Counterparty Freezes: Binance announced a phased halt on processing transactions with 16 third-party crypto platforms and service providers—including HTX (formerly Huobi)—to adhere to EU and US sanctions regulations, creating operational friction, wallet freeze threats, and liquidity fragmentation across Binance-connected asset channels.
- Cross-Chain Bridge Security Vulnerabilities: Ahead of the scheduled August 25 Pasteur hard fork aimed at patching cross-chain infrastructure and validator controls, market participants remain cautious due to recent bridge security incidents, including a multi-million-dollar exploit on the Wanchain cross-chain bridge that underscores persistent protocol-level downside risks.
- Overhead Technical Resistance and Volume Divergence: BNB/USD remains capped under major overhead resistance enforced by its 200-day exponential moving average near $648–$661 and channel tops near $610–$620, where light spot volume relative to historical averages leaves price vulnerable to sudden rejections and pullbacks toward $570–$590.
- Leverage Concentration and Long Liquidation Risk: On-chain derivatives data reveals concentrated long leverage and tight downside liquidation clusters positioned between $590 and $598, creating elevated downside risk if price action breaks below immediate technical support.
Recommended Articles


