


The Dollar Index breaks on the fourth consecutive soft print
- DXY opens at its session high just short of 100.00 and pierces 99.50.
- July retail sales -0.6% against a 0.1% consensus, sentiment 51 from 55.2.
- The Yen down 0.7% on the week as the joint intervention effect fades.
The Dollar Index took a payroll contraction on August 7, a cooler consumer price reading on August 12 and a flat producer price reading on August 13 without surrendering its range. Friday's data finally did it. July retail sales contracted 0.6% against a consensus for a 0.1% gain, preliminary August consumer sentiment landed at 51 against a 54.5 consensus, and the index opened at its session high just short of 100.00 before piercing 99.50.
The print the Dollar was not braced for
The rate story had already turned before Friday and the currency had declined to follow it. Employers shed jobs in July, consumer prices cooled and producer prices came in flat, and through all three the index held a band roughly half a point wide. What survived those prints was a single argument, that a resilient consumer still gave the Committee room to tighten into an energy shock.
Friday removed the consumer from that sentence. Headline retail sales fell 0.6% where the consensus looked for a 0.1% gain, sales excluding autos fell 0.3% against a 0.2% consensus, and the control group swung to -0.4% from a 0.4% rise the month before. Futures now carry roughly a 31% chance of a September increase against something close to even odds a week ago, with a move by December marked near 64%. The front end ratified that inside the hour, the two-year yield trading briefly beneath 4.10% and its lowest since June 30.
The August floor was official
The level this index has defended all month was not built by the market. Tokyo bought Yen in record single-session size in early August and followed it with a second tranche coordinated with the US Treasury, an operation aimed squarely at the index's second-largest weight. A price set by the issuer of the reserve currency helping to sell it is policy rather than price discovery, and policy levels do not defend themselves.
That defence is already wearing off. The Yen is on track for a weekly decline of roughly 0.7% in spite of Friday's gain, sitting near 159.00 per Dollar after trading at four-decade lows near 164.00 before July's operation. Wire reporting has the Bank of Japan preparing to raise rates as soon as September and weighing a faster sequence after that, which points the same way as the intervention without costing anything. The Dollar's second-biggest counterweight now carries both a hawkish central bank and an official bid.
The war stopped paying
The geopolitical bid that was supposed to put a floor under this index did not turn up when it was needed. Washington and Tehran moved backwards this week, with the president claiming total control of the Strait of Hormuz on Wednesday, Iran's foreign minister answering that the claim rests on intelligence failures, and the War Secretary saying the naval blockade can be maintained indefinitely. Brent trades near $87.00, the strait stays shut, and the Dollar fell regardless.
That absence reframes the compression this chart has shown all month. The standard reading had rates arguing one way and geopolitics the other, with the index pinned between two live cases. The cleaner reading is that the rate case has been one-way since the payroll contraction and an official bid was holding the level, which is why the break arrived on a consumer print rather than on a headline out of the Gulf. The Euro carries the argument better than the Yen does. A bloc that imports most of its energy through a chokepoint somebody else controls is buying its currency above 1.1550 against the currency of a country that pumps its own, which is not how a war premium is supposed to distribute.
What next week has to answer
The calendar hands the argument to the minutes. The Federal Open Market Committee (FOMC) record of the July meeting publishes on Wednesday at 18:00 GMT, covering the first three-way dissent in one direction since 2016, and a committee that split that way six weeks ago now faces a market pricing under a third odds of the increase those dissenters voted for.
Ahead of that, housing starts and building permits land on Tuesday against 1.427 million and 1.374 million priors, with industrial production at a 0.3% consensus on the same morning. Friday brings preliminary August Purchasing Managers Index (PMI) readings against 53.9 manufacturing and 54.6 services priors, the first activity survey to cover the month itself rather than the one the consumer has already spoiled.
Levels
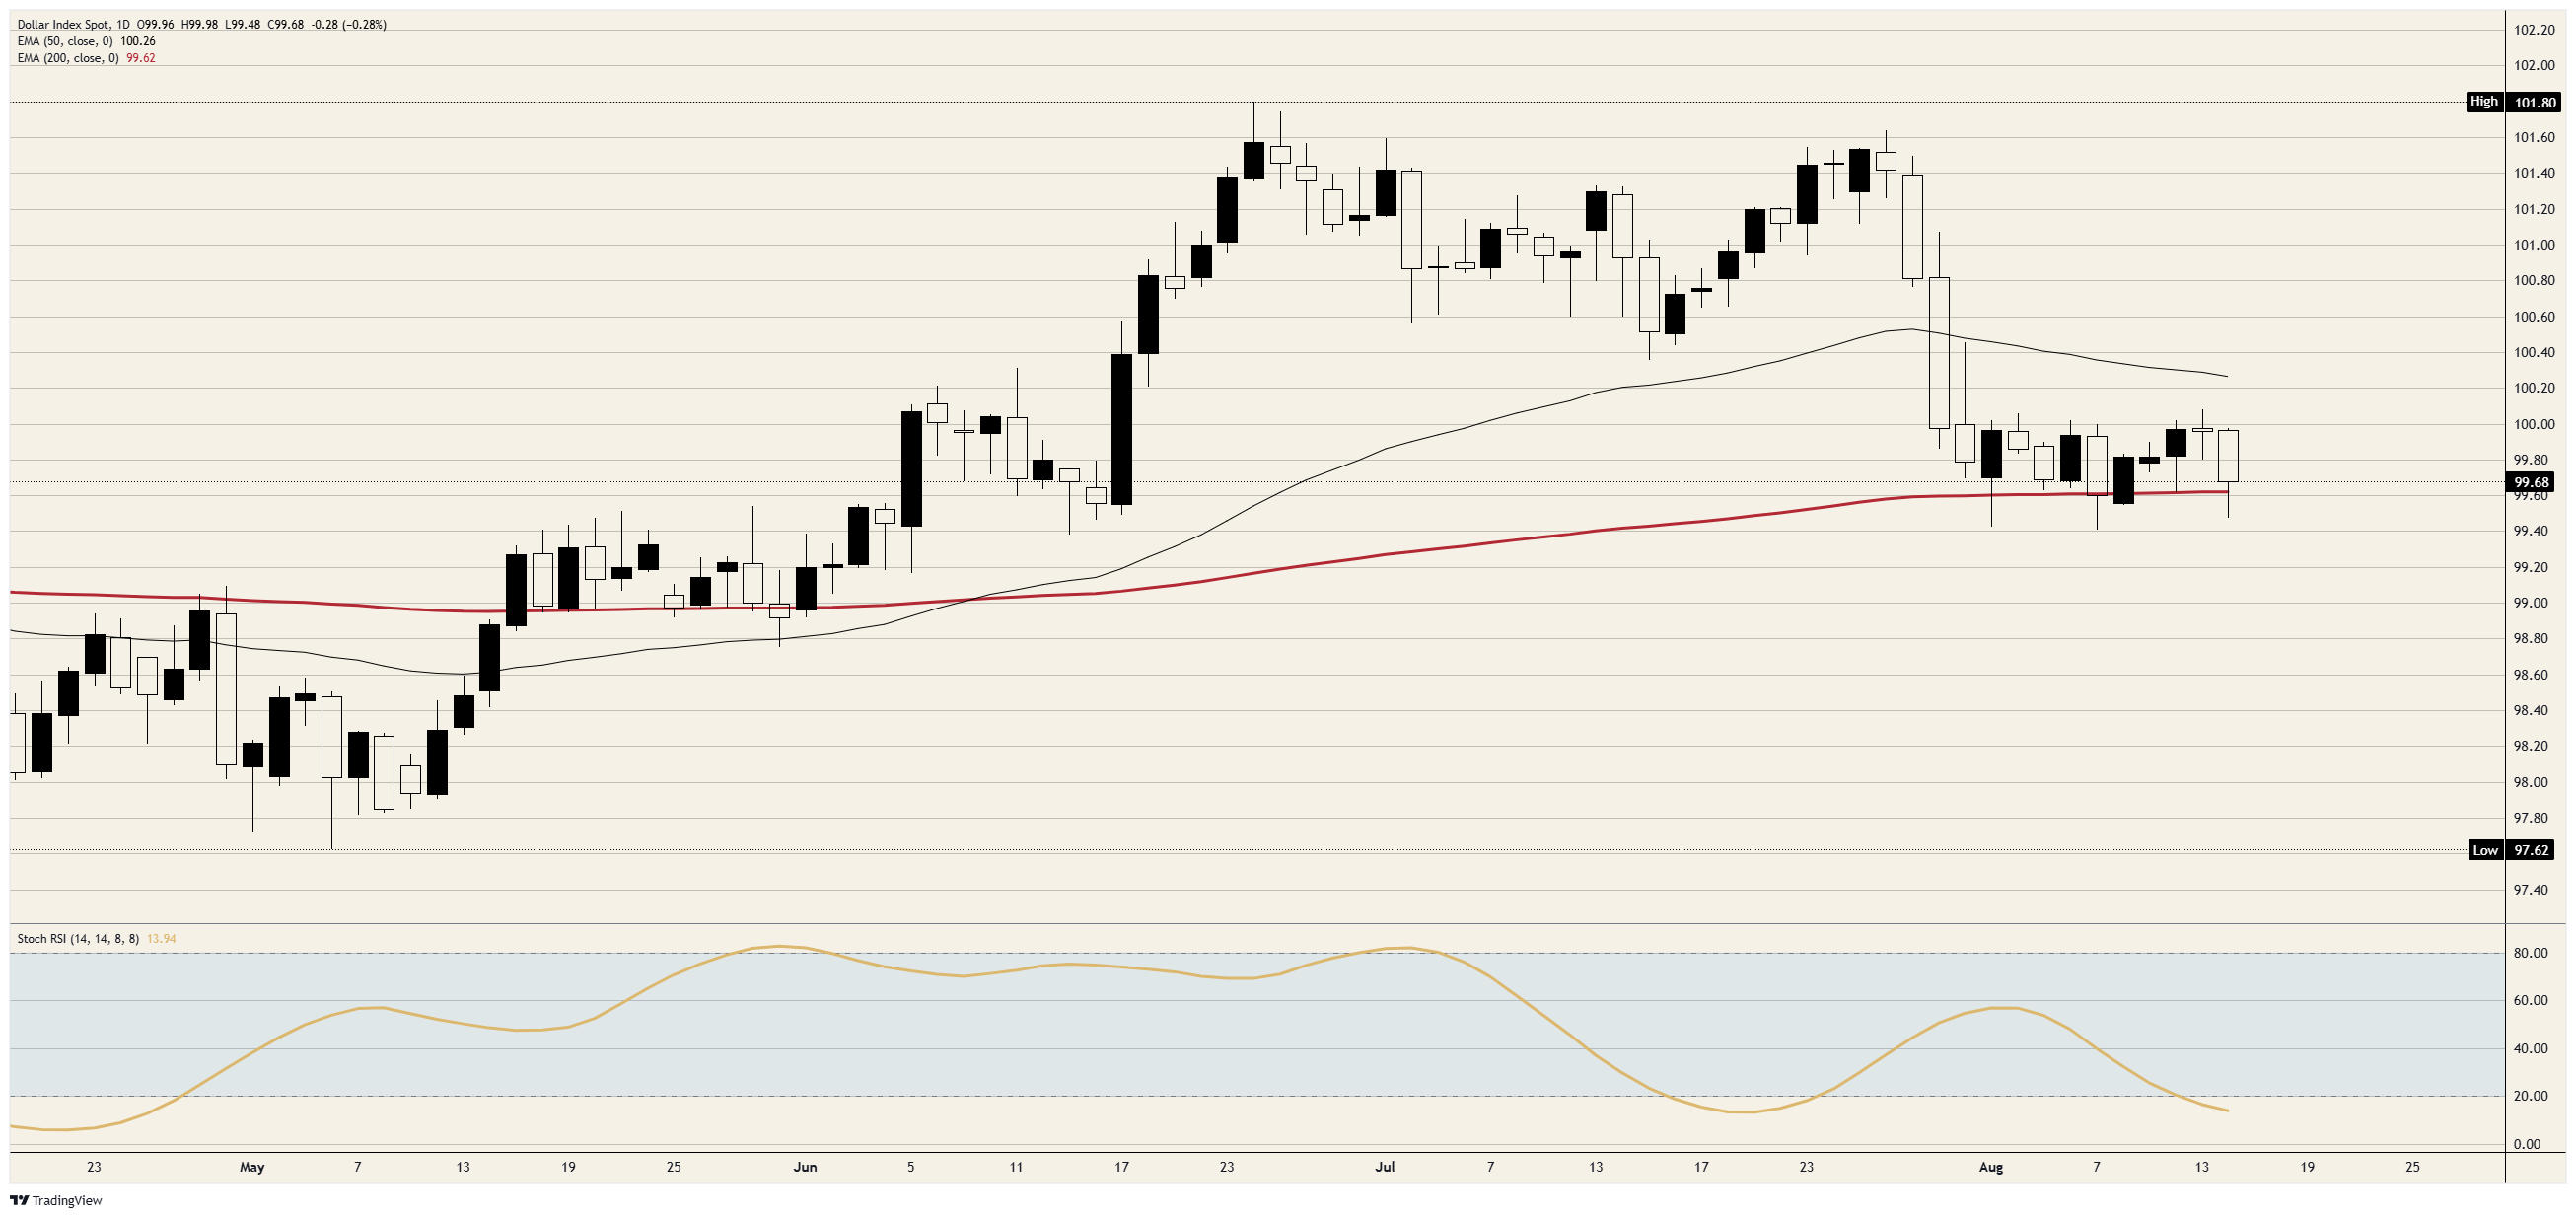
Resistance: The session high stopped just short of the 100.00 handle, which is the line that decides the next fortnight, with the declining 50-day Exponential Moving Average (EMA) near 100.25 sitting directly above it. Beyond that band, 100.50 and the 101.00 area are the reclaim levels, and the July peak near 101.75 is the ceiling on the chart.
Support: The 99.50 shelf and the rising 200-day EMA near 99.60 form one band, and the session traded through both before recovering above them. A daily close beneath that band opens 99.00, then 98.50, with the spring low near 97.60 the floor on the chart.
Bias: Bearish beneath the 100.00 handle. An index that opens at its high, pierces its slower moving average and cannot regain the figure, while the pricing that supported it is cut from even odds to under a third in a week, is trending rather than consolidating. Objectives 99.00 then 98.50, invalidation on a daily close back above the 50-day EMA near 100.25. The daily Stochastic Relative Strength Index (Stoch RSI) near 14 is a warning about the timing of the next bounce, not about the direction of the trend.
DXY daily chart
US Dollar FAQs
The US Dollar (USD) is the official currency of the United States of America, and the ‘de facto’ currency of a significant number of other countries where it is found in circulation alongside local notes. It is the most heavily traded currency in the world, accounting for over 88% of all global foreign exchange turnover, or an average of $6.6 trillion in transactions per day, according to data from 2022. Following the second world war, the USD took over from the British Pound as the world’s reserve currency. For most of its history, the US Dollar was backed by Gold, until the Bretton Woods Agreement in 1971 when the Gold Standard went away.
The most important single factor impacting on the value of the US Dollar is monetary policy, which is shaped by the Federal Reserve (Fed). The Fed has two mandates: to achieve price stability (control inflation) and foster full employment. Its primary tool to achieve these two goals is by adjusting interest rates. When prices are rising too quickly and inflation is above the Fed’s 2% target, the Fed will raise rates, which helps the USD value. When inflation falls below 2% or the Unemployment Rate is too high, the Fed may lower interest rates, which weighs on the Greenback.
In extreme situations, the Federal Reserve can also print more Dollars and enact quantitative easing (QE). QE is the process by which the Fed substantially increases the flow of credit in a stuck financial system. It is a non-standard policy measure used when credit has dried up because banks will not lend to each other (out of the fear of counterparty default). It is a last resort when simply lowering interest rates is unlikely to achieve the necessary result. It was the Fed’s weapon of choice to combat the credit crunch that occurred during the Great Financial Crisis in 2008. It involves the Fed printing more Dollars and using them to buy US government bonds predominantly from financial institutions. QE usually leads to a weaker US Dollar.
Quantitative tightening (QT) is the reverse process whereby the Federal Reserve stops buying bonds from financial institutions and does not reinvest the principal from the bonds it holds maturing in new purchases. It is usually positive for the US Dollar.
Recommended Articles


