


Gold Price Forecast: Can Gold Keep Rising After Reclaiming $4,400 as Markets Await Upcoming CPI Data?

 Trending Articles
- Gold Price Forecast: Gold Rises as Nonfarm Payrolls Unexpectedly Turn Negative; Can CPI and PPI Help Break $4,500?
- Hormuz tensions escalate as unconfirmed missile attack amid fragile US-Iran talks
- Gold Price Forecast: Cooling Rate Hike Expectations Push Gold Above $4,400, Eyeing $4,500 Next
- Gold Price Forecast: Can Gold Still Rise Above $4,300 Ahead of July Non-Farm Payrolls?
- Gold rallies to two-week high as USD softens on Iran deal hopes, receding Fed hike bets
- Australian Dollar remains calm following Trade Balance data

TradingKey - During Wednesday's Asian trading session, spot gold (XAUUSD) extended its rebound, reclaiming $4,400/oz. As of 11:08 Beijing time on August 12, spot gold was trading at $4,414.705/oz, up $46.460, or about 1.06%. This marks the third time in two days that gold prices have broken through the $4,400 mark, indicating that the tug-of-war between bulls and bears around this key price level remains fierce.
In the previous trading day, volatility in the gold market escalated significantly. During early trading on August 11, spot gold surged rapidly to break through $4,400 and tested higher to around $4,436, before the momentum quickly reversed, sending prices back down to around $4,356 at one point. Later that evening, gold bounced back above $4,400, ultimately pulling back slightly to near $4,369. Repeatedly testing $4,400 in a short period indicates that this level has become a crucial technical threshold under close market scrutiny.
Why Gold Prices Are Rising
Gold has shown strength recently, with the core drivers remaining Fed rate cut expectations, US inflation data, and geopolitical risks.
Previously released US employment data signaled a cooling labor market, with job growth coming in weaker than market expectations. This further reinforced investors' assessment of slowing economic growth and prompted the market to raise its expectations for a future Fed policy pivot toward easing. Amid changing interest rate expectations, gold's relative attractiveness rose accordingly.
Meanwhile, concerns over transit security around the Strait of Hormuz have intensified recently, and shipping risks near the Red Sea and the Bab-el-Mandeb Strait have also increased, leading to heightened uncertainty for energy supplies and global trade. This has not only driven up the risk premium in crude oil markets but also boosted market demand for safe-haven assets.
Currently, market attention has shifted to the upcoming US July Consumer Price Index (CPI). The market expects the US July CPI to rise 0.1% month-over-month, with year-over-year growth slowing to 3.4% from 3.5% in June; core CPI is expected to rise 0.2% month-over-month, with year-over-year growth easing to 2.5% from 2.6%.
If actual data meets or falls below expectations, the market may further confirm that inflation is cooling, thereby weakening the need for the Fed to continue raising interest rates and renewing expectations for future policy easing. Under such circumstances, the US dollar and real US Treasury yields could come under pressure, enhancing the allocation appeal of gold as a non-yielding asset.
Over the medium to long term, the bullish thesis for gold remains intact. UBS expects gold prices to potentially reach $5,000 per ounce in the first half of 2027. The institution believes that falling future real interest rates, a weaker US dollar, investors diversifying away from US dollar assets, and persistent central bank gold purchases will provide crucial support for gold's medium- to long-term gains.
Gold Price Technical Analysis
Source: TradingView
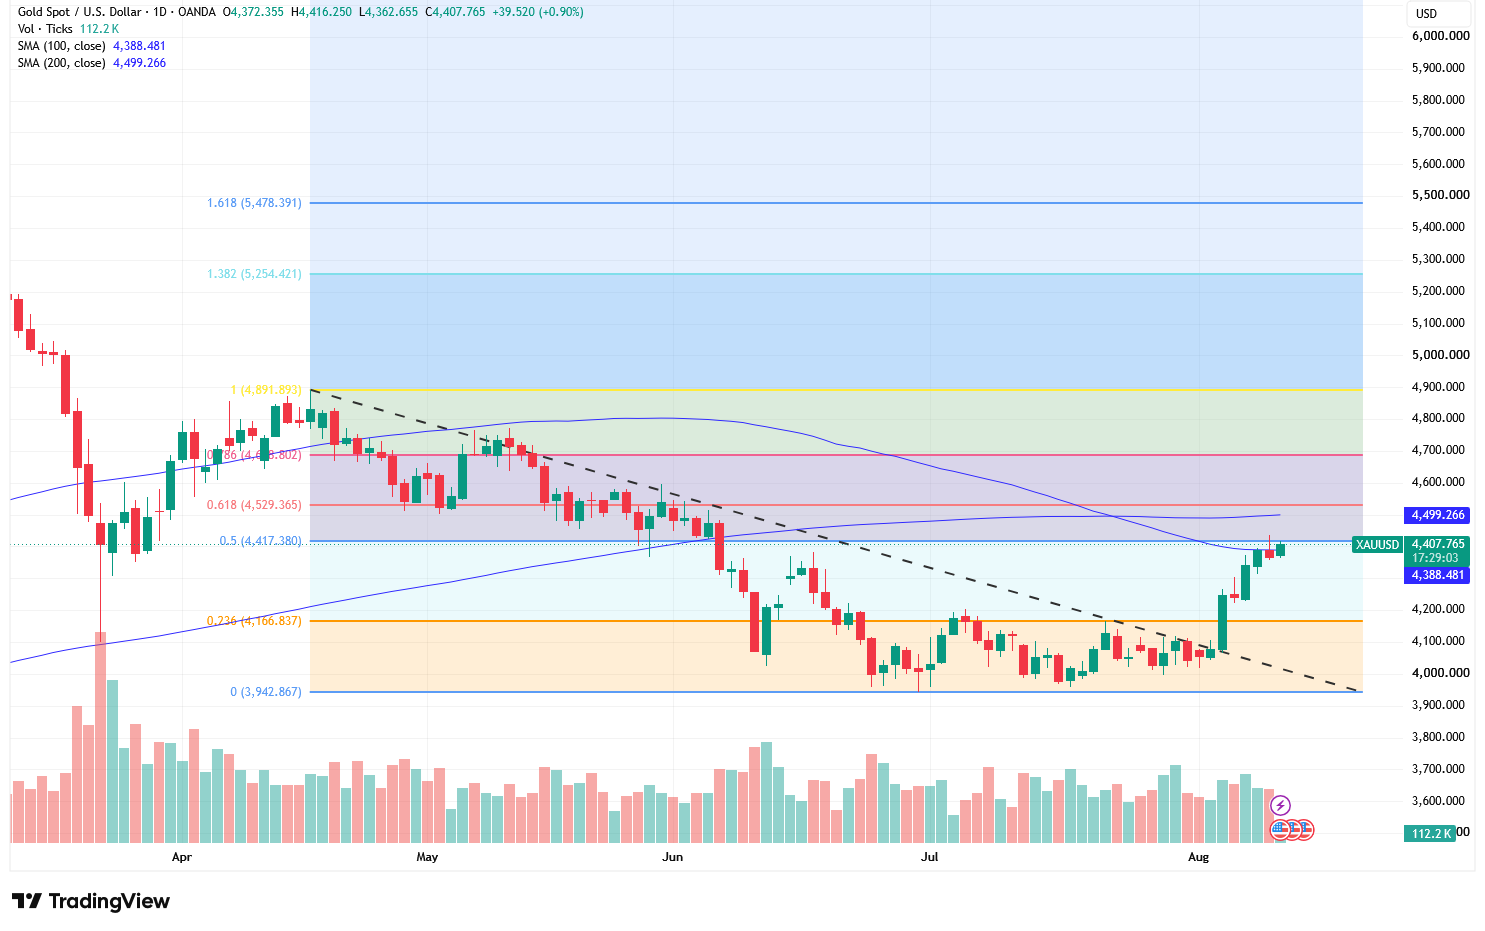
Spot gold daily prices previously pulled back continuously from $4,891.893, forming a clear downtrend. After halting its decline near $3,942.867, the price completed a period of sideways base-building in the $3,943–$4,167 region. Entering August, gold saw consecutive gains with expanding volume, sequentially breaking above the downward trendline and the 23.6% Fibonacci retracement level at $4,166.837, before reclaiming the 100-day moving average at $4,388.480. This indicates that the short-term bearish trend has been broken, and the market has entered a clear rebound and recovery phase.
Currently, gold is testing the 50% Fibonacci retracement level at $4,417.380. The latest daily high reached $4,416.250, indicating notable resistance around $4,417.
If the daily candle can close effectively above $4,417 and hold the $4,388–$4,417 range during subsequent pullbacks, prices are expected to further test the core resistance zone of $4,499–$4,529. This area encompasses both the 200-day moving average and the 61.8% Fibonacci retracement level, serving as a key inflection point to determine whether the medium-term trend can shift from bearish to bullish. Only a high-volume breakout and consolidation above $4,529 will open the door for gold to target $4,688.802, and subsequently challenge the previous high of $4,891.893.
To the downside, the 100-day moving average at $4,388 serves as the nearest dynamic support; combined with the session low, $4,360–$4,390 forms the primary short-term defense zone. If prices face resistance near $4,417 and fall back below $4,388, the rally may transition into a technical correction, with the next support zone to watch at $4,280–$4,320.
Read more
* The content presented above, whether from a third party or not, is considered as general advice only. This article should not be construed as containing investment advice, investment recommendations, an offer of or solicitation for any transactions in financial instruments.


