


Bitcoin Price Forecast: Persistent ETF inflows, easing Middle East tensions lift risk appetite


Bitcoin extends gains on Thursday, breaking above the key 50-day EMA at $64,670.
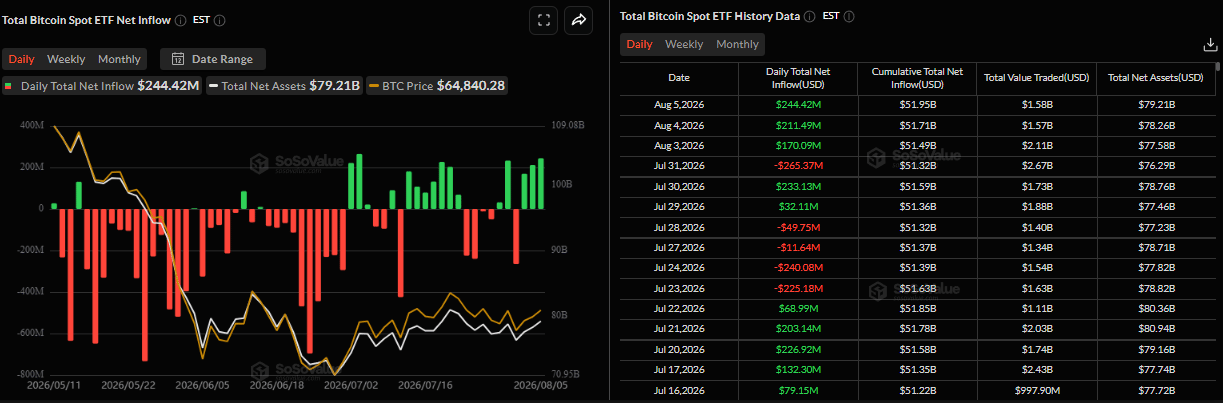
US-listed spot BTC ETFs recorded net inflows of $244.42 million on Wednesday, marking the third consecutive day of positive flows.
Easing Middle East geopolitical tensions and firm hopes of Hormuz reopening cap energy-market concerns, boosting risk sentiment.
Bitcoin (BTC) extends its gains, trading above $64,800 at the time of writing on Thursday, breaking above the key resistance zone. Institutional demand supports BTC price action with spot Exchange Traded Funds (ETFs) recording a third consecutive day of inflows so far this week. Meanwhile, easing Middle East geopolitical tensions and firm hopes of the Strait of Hormuz reopening cap energy-market concerns and support broader risk sentiment.
Easing US-Iran tensions and lower Oil prices support risk sentiment
Iran’s Foreign Ministry spokesperson, Esmaeil Baghaei, said on Wednesday that his country is in the final stage of drafting an agreement with Oman over the strategic waterway, the Strait of Hormuz.
A senior Gulf official said there is a 50% chance that Iran and Oman will reach an agreement on Hormuz by Friday.
These easing developments have fueled hopes about the major oil chokepoint's reopening, with crude prices trading lower throughout the week. A sustained decline in the black liquid could ease energy-market concerns, reduce inflationary pressures and lower expectations for a more hawkish Federal Reserve (Fed), supporting risk assets such as BTC.
On the economic data front, Automatic Data Processing (ADP) reported on Wednesday that private-sector employment in the US grew by 44K in July, marking a notable slowdown from the 98K in the prior month and missing consensus estimates of 70K. Separately, figures from the Institute for Supply Management (ISM) showed the Services PMI in the US improved a tad to 54.1 in July from 54 in the previous month, coming in below expectations for a reading of 54.5.
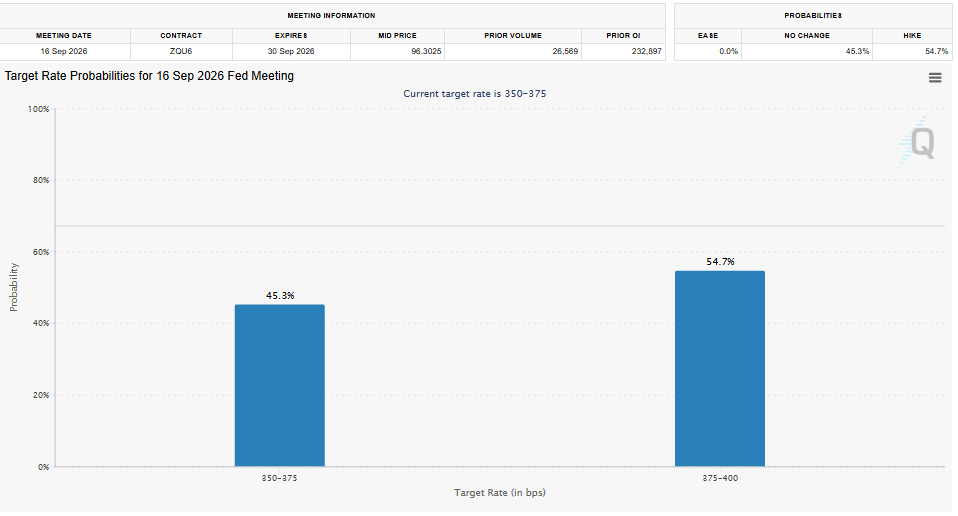
Following the softer data, and according to the CME FedWatch tool, the probability for a September Fed rate hike eased to roughly 55% on Thursday from 67% at the start of the week, which is seen exerting pressure on the US Dollar and supporting risk assets such as BTC.
Persistent institutional demand supports Bitcoin recovery
Institutional demand continues to strengthen. SoSoValue data show that spot BTC ETFs recorded an inflow of $244.42 million on Wednesday, marking the third consecutive day of positive flows so far this week. If these inflows continue and intensify throughout the week, BTC could see a recovery.
Bitcoin technical outlook: BTC could extend gains if it closes above 50-day EMA
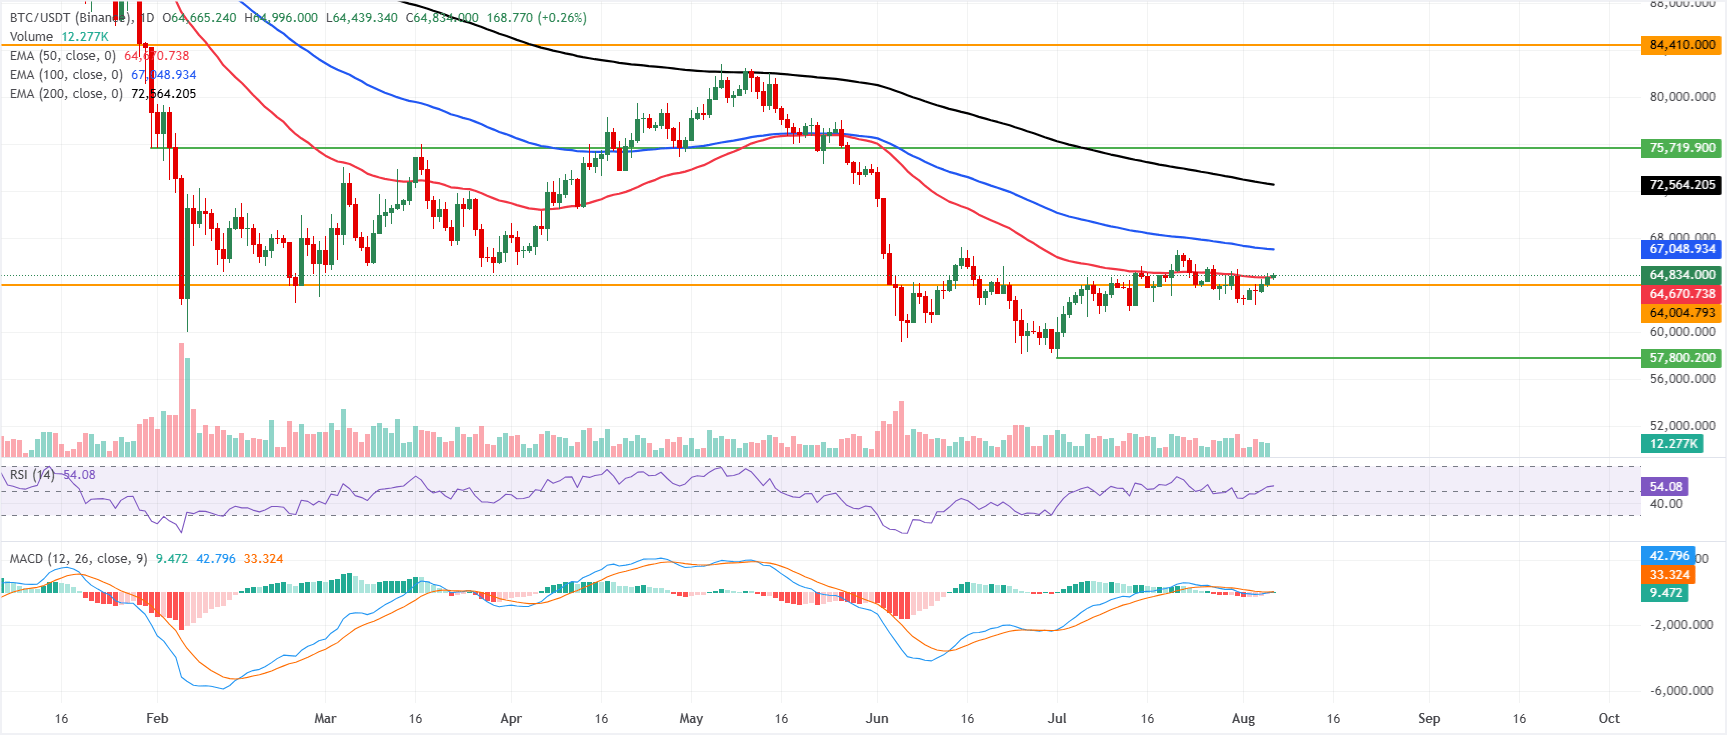
Bitcoin price trades at $64,830 on Thursday, holding above the 50-day Exponential Moving Average (EMA) at $64,670 but still capped well below the 100-day EMA at $67,049 and the 200-day EMA at $72,564.
This placement keeps the broader trend constrained while hinting at a tentative constructive tone in the near term, as the Relative Strength Index (RSI) at 54 drifts slightly above its midline on the daily chart and the Moving Average Convergence Divergence (MACD) turns marginally positive, suggesting recovery but still modest bullish momentum.
On the downside, immediate support is clustered around the 50-day EMA at $64,670, ahead of a stronger horizontal floor near $64,004.
On the topside, buyers face initial resistance at the 100-day EMA at $67,049, with further upside hurdles at the 200-day EMA at $72,564 before a more distant horizontal barrier emerges near $84,410, which would need to be reclaimed to open a more decisive bullish phase.
(The technical analysis of this story was written with the help of an AI tool. Know more.)
Read more
* The content presented above, whether from a third party or not, is considered as general advice only. This article should not be construed as containing investment advice, investment recommendations, an offer of or solicitation for any transactions in financial instruments.


