


EUR/USD Price Forecast: 100-Day SMA blocks bullish reversal
- EUR/USD rebounds from daily lows, challenging 100-day SMA resistance.
- Bullish RSI raises reversal risk after reclaiming 1.1500.
- Break above 1.1629 exposes 1.1685 and 1.1700 next.
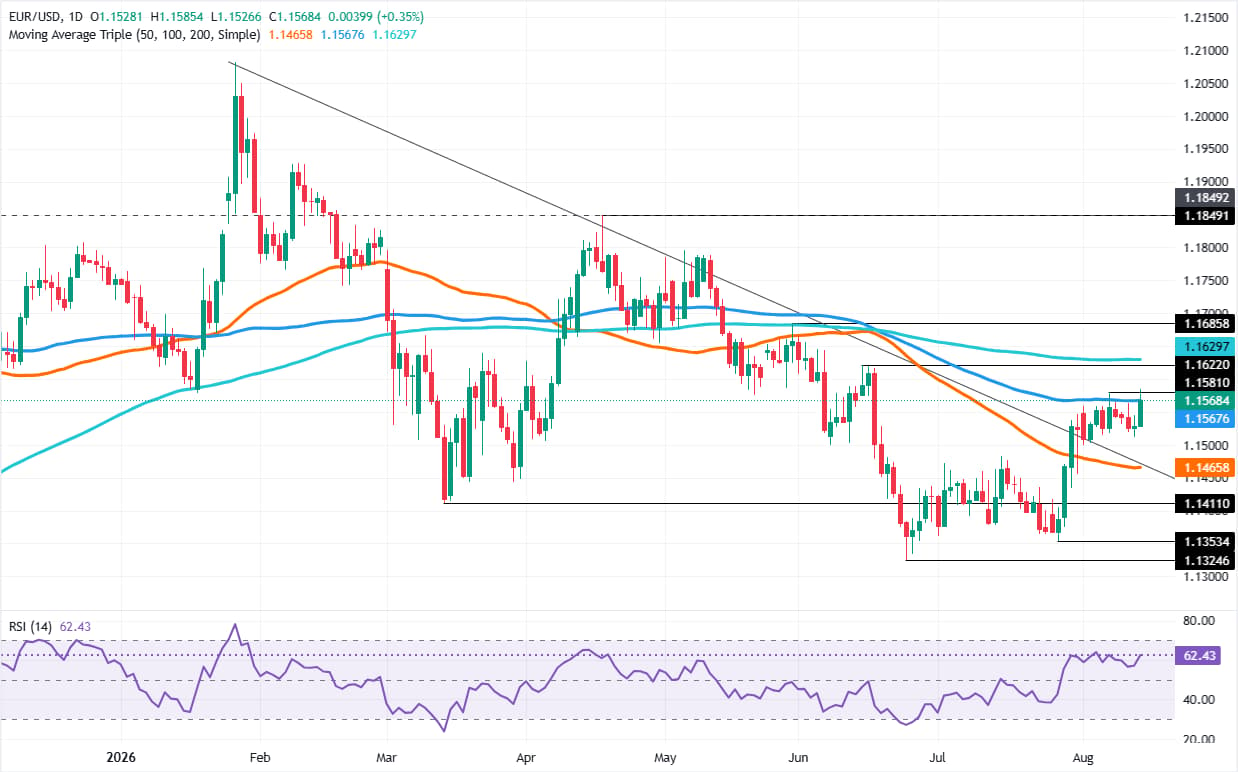
The EUR/USD registers gains of over 0.32% as traders face key resistance at the 100-day Simple Moving Average (SMA) at 1.1567, as bulls eye the 1.1600 psychological figure. At the time of writing, the pair trades at 1.1564 after bouncing off daily lows of 1.1526.
EUR/USD Price Forecast: Technical Outlook
The EUR/USD market structure suggests that the downtrend remains intact. The successive lower highs and lower lows have been respected, but since July 30, when the pair reclaimed the 1.1500 area, the risk of a ‘bullish reversal’ has increased.
Although the pair topped around 1.1550-60, the Relative Strength Index (RSI) suggests bullish momentum is building. With that said, the EUR/USD might turn bullish if traders clear key resistance levels.
Upwards, the 200-day SMA at 1.1629 is the next area of interest. Once surpassed, the next cycle high pending is the May 29 high at 1.1685. If those two levels are removed, EUR/USD could be headed toward 1.1700, putting the April 17 high at 1.1849 into play ahead of the 1.1900 area.
On the flip side, if the shared currency drops below 1.1500, a move to the 50-day SMA at 1.1465 is on the cards. The next demand zone would be 1.1400.
EUR/USD Price Chart – Daily
Euro Price This week
The table below shows the percentage change of Euro (EUR) against listed major currencies this week. Euro was the strongest against the Japanese Yen.
| USD | EUR | GBP | JPY | CAD | AUD | NZD | CHF | |
|---|---|---|---|---|---|---|---|---|
| USD | -0.13% | -0.36% | 1.02% | -0.54% | -0.28% | 0.07% | 0.66% | |
| EUR | 0.13% | -0.24% | 1.11% | -0.52% | -0.22% | 0.10% | 0.69% | |
| GBP | 0.36% | 0.24% | 1.29% | -0.27% | 0.02% | 0.34% | 0.92% | |
| JPY | -1.02% | -1.11% | -1.29% | -1.24% | -0.95% | -0.77% | -0.15% | |
| CAD | 0.54% | 0.52% | 0.27% | 1.24% | 0.29% | 0.47% | 1.25% | |
| AUD | 0.28% | 0.22% | -0.02% | 0.95% | -0.29% | 0.32% | 0.88% | |
| NZD | -0.07% | -0.10% | -0.34% | 0.77% | -0.47% | -0.32% | 0.57% | |
| CHF | -0.66% | -0.69% | -0.92% | 0.15% | -1.25% | -0.88% | -0.57% |
The heat map shows percentage changes of major currencies against each other. The base currency is picked from the left column, while the quote currency is picked from the top row. For example, if you pick the Euro from the left column and move along the horizontal line to the US Dollar, the percentage change displayed in the box will represent EUR (base)/USD (quote).
Recommended Articles


