

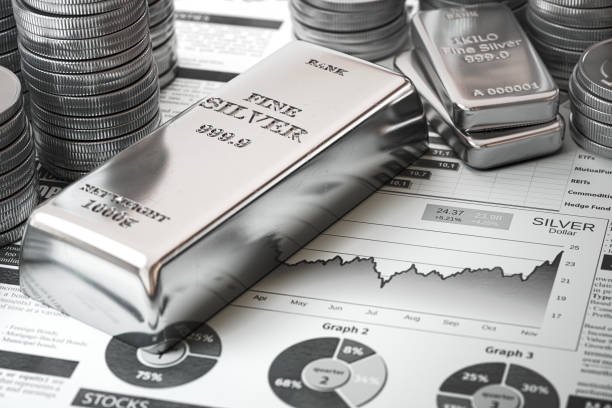
Silver Price Analysis: XAG/USD tumbles as bearish engulfing pattern looms

- Gold Price Forecast: Oil Price Breaking $100 Fuels Inflation Concerns, Will Gold Prices Fall Further?
- Gold Price Trend Forecast: Expectations of Easing US-Iran Tensions Boost Gold Prices, $4,070 Becomes Key Level for Bulls and Bears
- Gold rallies to over two-week high, eyes $4,150 as traders track US-Iran diplomacy efforts
- Euro declines to near 1.1400 as US launches fresh strikes on Iran
- Tesla Q2 Earnings Preview: Record Deliveries Fail to Hide Profit Pressure, Can Musk Rely on AI and Autonomous Driving to Unlock New Growth Space?
- WTI climbs above $87.00 as Middle East conflict threatens key choke points
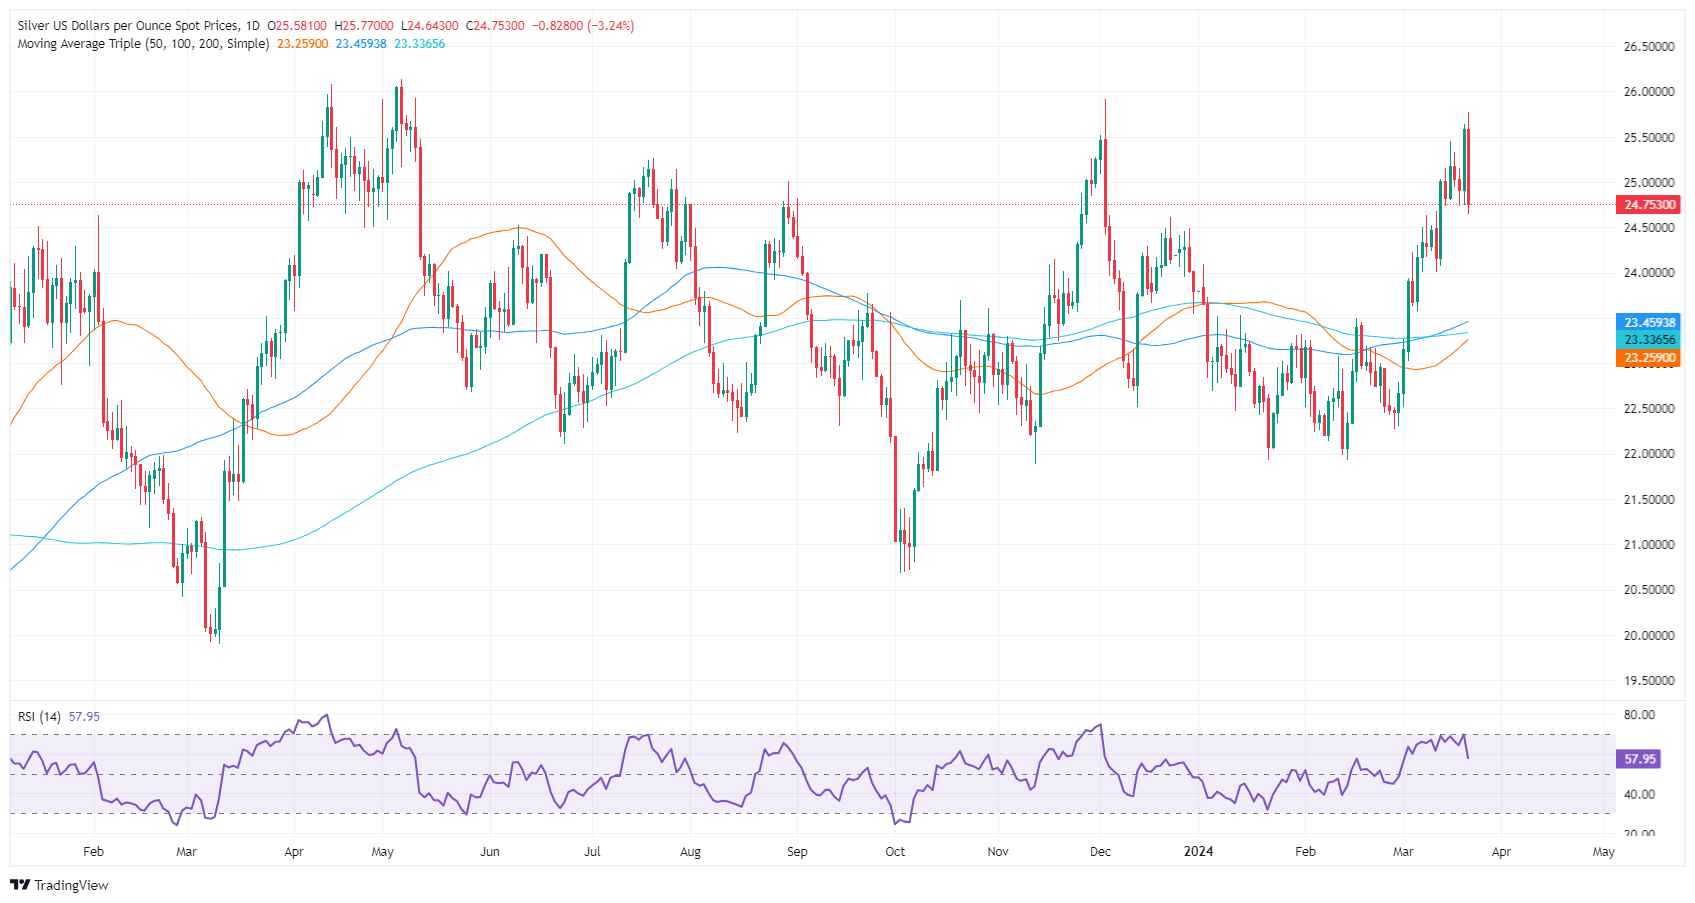
•Silver prices see a significant drop to $24.75, shedding over 3% in response to a strengthening US Dollar.
•Technical analysis reveals a bearish engulfing pattern, despite a recent 'golden cross', signaling mixed signals for traders.
•The RSI indicates diminishing buying pressure, hinting at a potential bearish swing.
Silver's price plunged on Thursday amidst a risk-off impulse, reinvigorating the US Dollar. Consequently, the grey metal dropped more than $0.70, or 3.15%, as the XAG/USD traded at $24.75 after hitting a daily high of $25.77.
XAG/USD Price Analysis: Technical outlook
Silver is witnessing a downturn, as price action has formed a ‘bearish engulfing’ chart pattern in the last couple of days. Even though the 50-day moving average (DMA) has crossed above the 200-DMA, forming a classic ‘golden cross’ indicating that bulls are gathering steam, momentum suggests the opposite.
The Relative Strength Index (RSI) is hovering just below 60 after peaking around 70, indicating that moderate buying pressure remains. However, the RSI's descent from higher levels suggests that momentum might wane, and bears could gain ground.
The recent pullback has seen the price retreat from resistance near the $26.00 mark. Immediate support is found near December’s 22 high turned support at $24.60, followed by the $24.00 level. A breach of the latter could open a path towards the $23.00 area, marked by the previous cycle lows.
On the other hand, an XAG/USD daily close above $25.00 could pave the way for challenging yearly highs at $25.77, followed by last year’s high at $25.91.
Read more
* The content presented above, whether from a third party or not, is considered as general advice only. This article should not be construed as containing investment advice, investment recommendations, an offer of or solicitation for any transactions in financial instruments.


