


Gold Prices Narrowly Hold $4,000 Level, When Will Precious Metals Selloff Stop?

 Trending Articles
- Bitcoin Suffers Year’s Strongest Waterfall-Style Decline. Will It Next Drop to the $60,000 Mark?
- Bitcoin drops below $65K amid reinforced bear market signals
- Forex Today: US Dollar stays resilient ahead of key US data
- $1.5 Billion in Crypto Assets Liquidated, Bitcoin Falls Below $66,000 Mark. What Is the Reason?

TradingKey - On June 10, Eastern Time, spot gold ( XAUUSD) fell through the $4,100 level during intraday trading after four consecutive sessions of selling, nearing the $4,000 psychological threshold; this decline represents the most severe retracement since 2023.
Since late May, gold prices have dropped nearly 10%, completely erasing year-to-date gains as the metal pulled back more than 22% from its all-time high of $5,598.75.
Where the sell-off will bottom out depends on the balance of three factors: when the market tempers Fed rate-hike expectations, when short-term selling pressure is exhausted, and whether global central bank demand can offset the capital exodus.
Rate hike expectations are the primary headwind.
The catalyst for the sell-off remains the shift in interest rate expectations.
Non-farm payrolls added 172,000 jobs in May, far exceeding market expectations and significantly dampening expectations for rate cuts this year; meanwhile, data released by the Bureau of Labor Statistics on Wednesday showed that the May Consumer Price Index (CPI) rose 4.2% year-on-year, the highest level since early 2023, marking the first time in three years that CPI inflation has breached the 4% threshold.
According to CME FedWatch data, the probability of a Fed rate hike in October has risen to around 42%, while the odds of a hike in December have surpassed 70%.
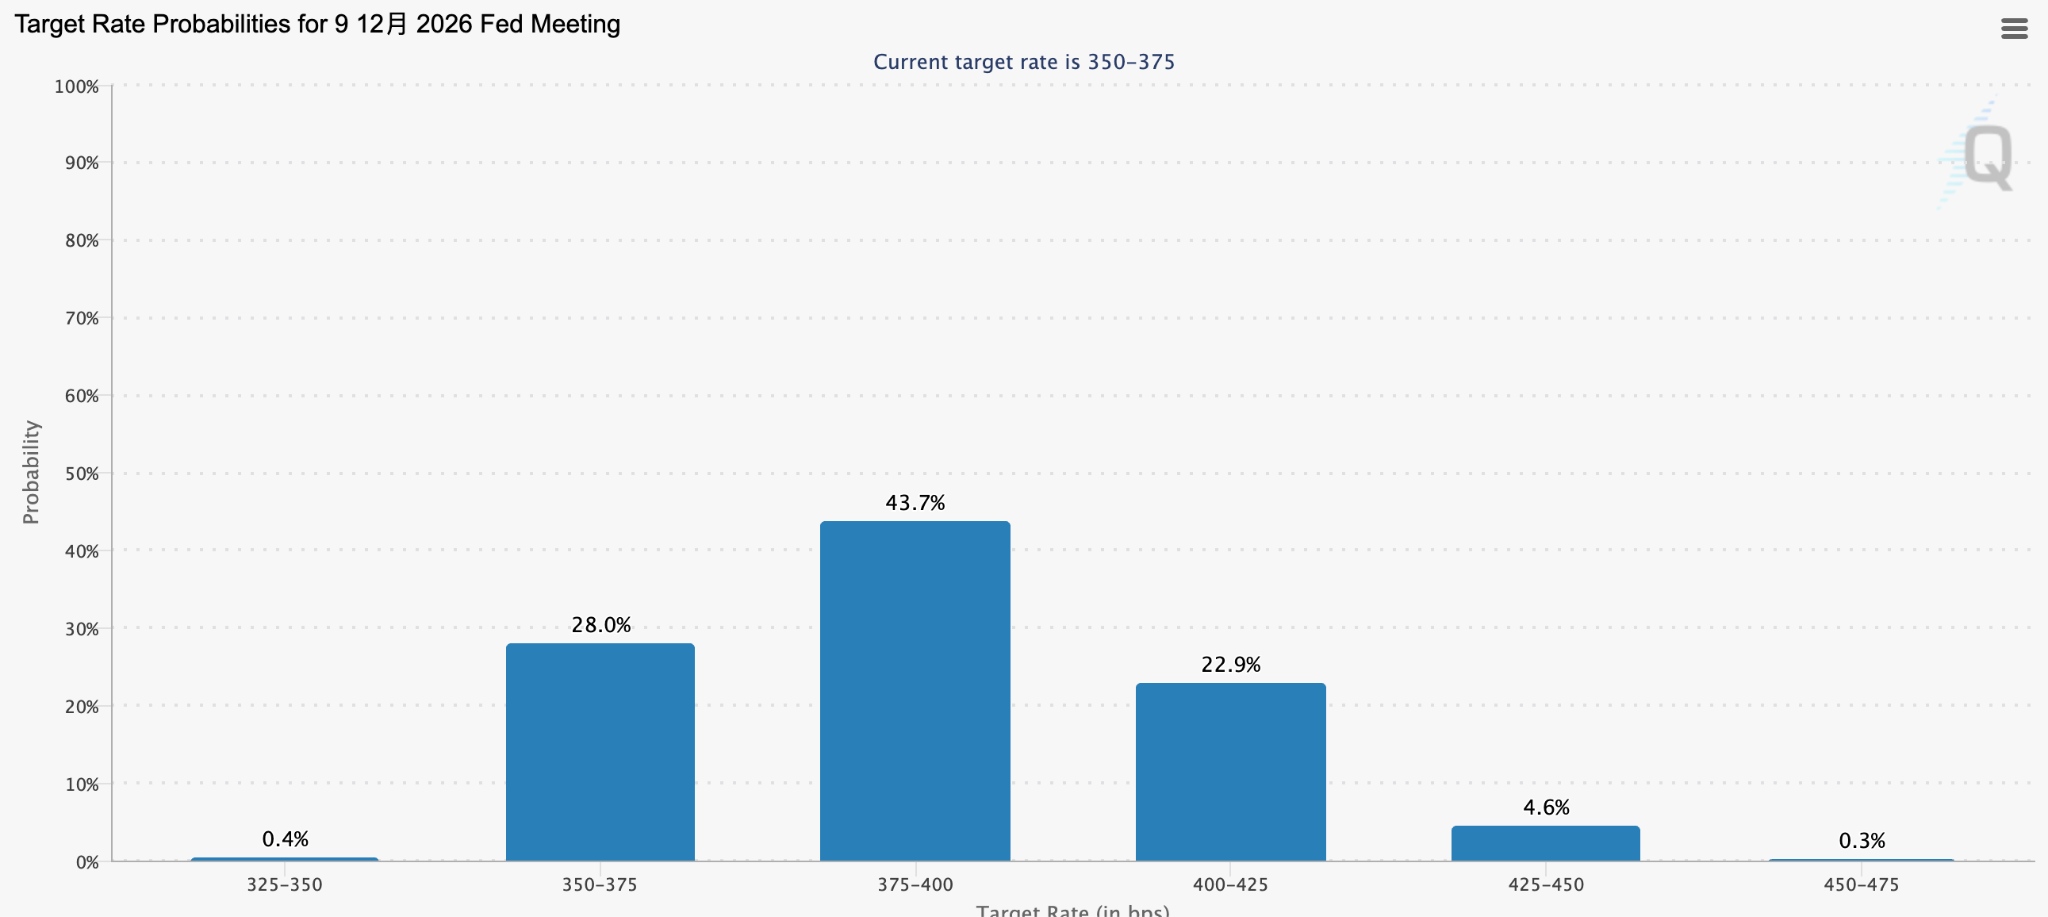
[Probability of a Fed rate cut in December, Source: CME FedWatch]
The inverse pricing relationship between gold prices and real interest rates has become particularly pronounced since late April, with the calibration of liquidity expectations becoming the dominant logic for current market pricing, rather than geopolitical risk premiums.
Citigroup's commodities team on June 9 slashed its three-month gold price target from $4,300 per ounce to $4,000, explicitly warning short-term investors that risks will be "extremely high" if wide stop-loss levels are not set.
Citigroup's calculation logic is quite straightforward: to sustain current gold price levels, physical gold purchases must maintain a pace of approximately $900 billion annually, whereas normal purchase volumes between 2010 and 2024 were only between $250 billion and $400 billion per year. In short, the current dependence of gold prices on physical demand has far exceeded historical norms.
Short-term Sell-off and Long-term Support
On the capital front, global investors are accelerating their exit from gold ETFs.
Data from the World Gold Council shows that global physical gold ETFs saw net outflows of $2 billion in May, with total assets under management (AUM) declining 2% month-on-month to approximately $600 billion, while overall holdings retreated to 4,121 tonnes, slightly below the record high of 4,176 tonnes set at the end of February.
However, the large-scale withdrawal of short-term speculative capital has not shaken the underlying support from long-term allocation funds.
The People's Bank of China's gold reserves reached 74.96 million ounces as of the end of May 2026, an increase of 320,000 ounces month-on-month, marking its 19th consecutive month of accumulation and positioning it as the most steadfast contrarian buyer during the market's descent. In the first quarter of 2026, net gold purchases by global central banks reached 244 tonnes, a 17% increase quarter-on-quarter, as emerging market central banks continued to significantly increase their gold holdings.
Key Support After Technical Breakdown
From a technical perspective, spot gold breached the $4,100 psychological threshold on June 10, reaching an intraday low near $4,070. Prices have slipped below the 250-day moving average for the first time since September 2023.
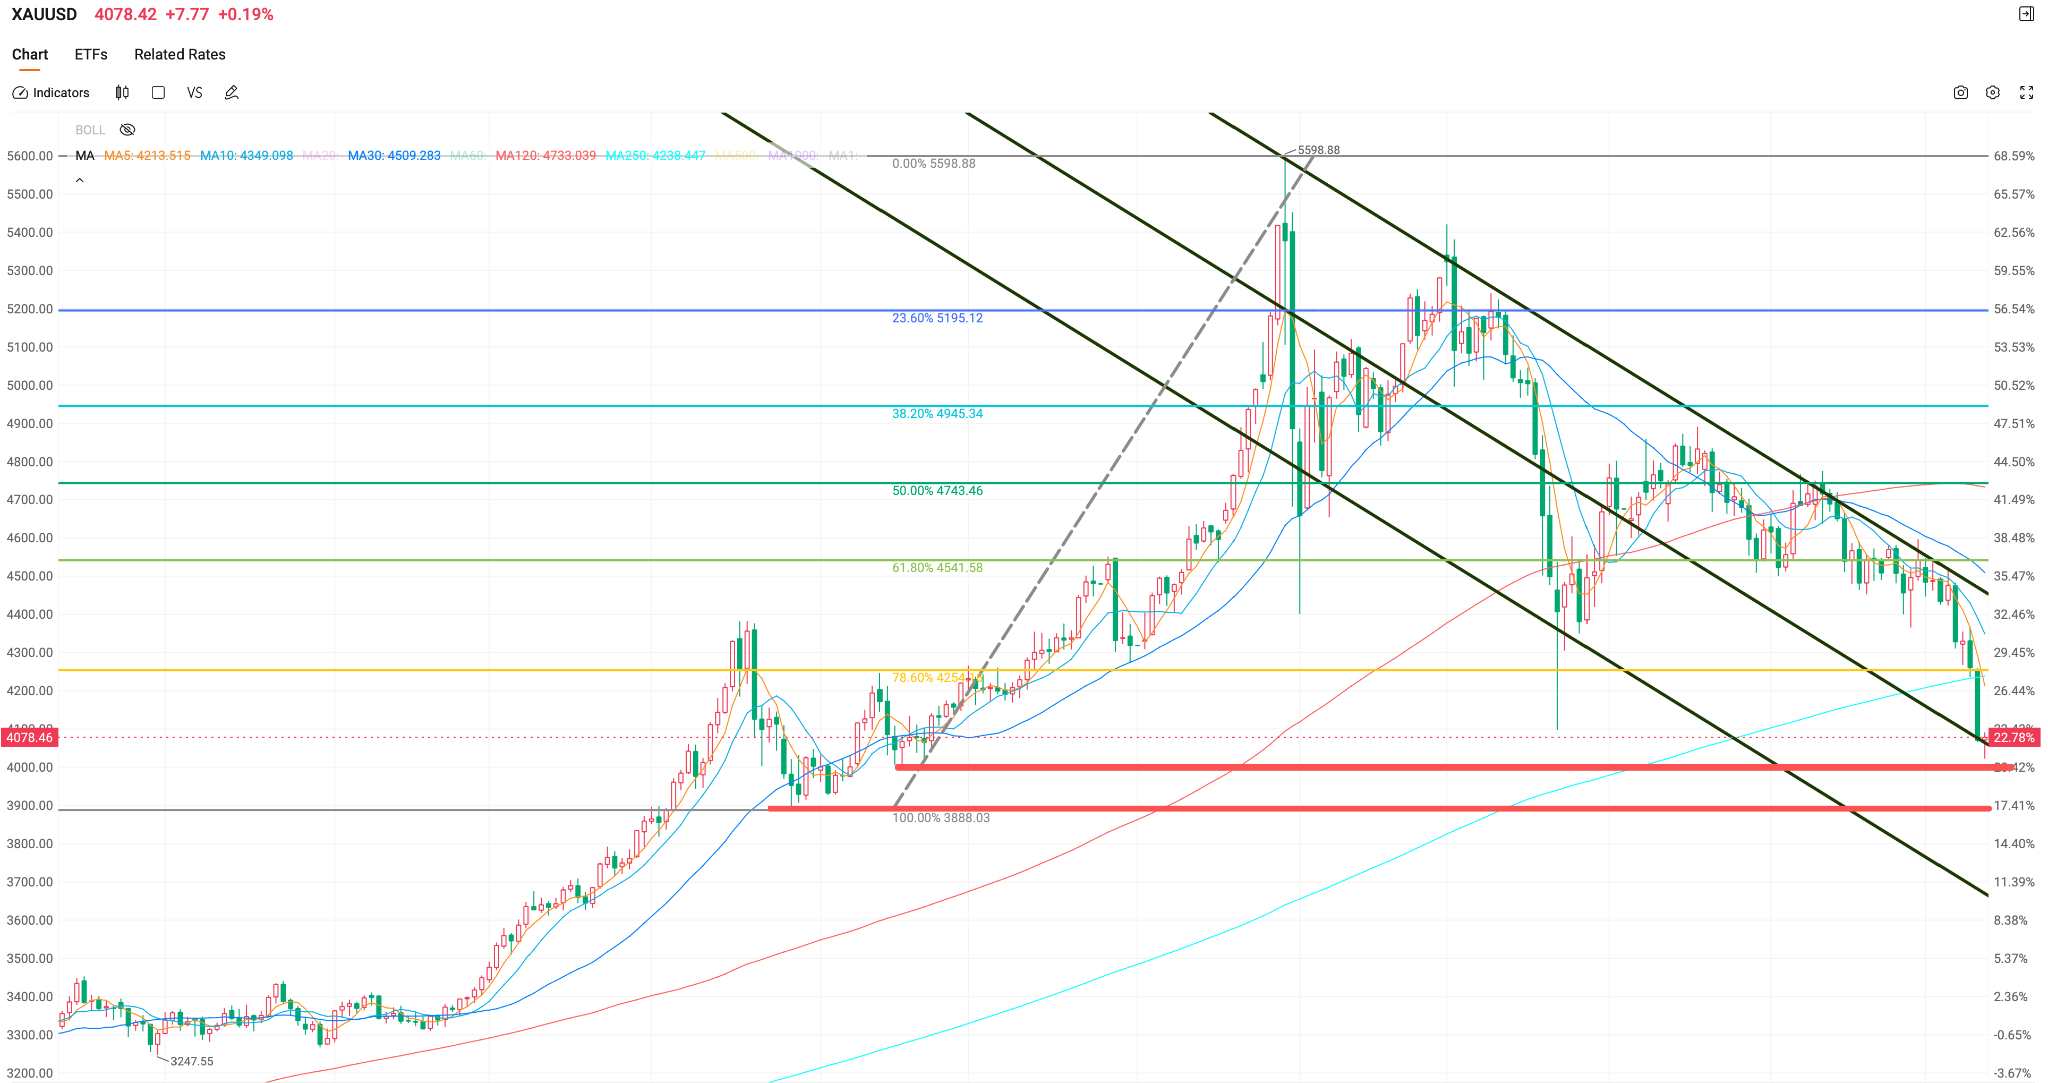
Analysis indicates that gold's decline below the critical $4,100 support level triggered stop-loss selling from programmatic trend traders. Analysts suggest that, given current market structures, a move toward the $4,000 psychological handle cannot be ruled out. Should the $4,000 mark be breached, gold prices will test the $3,888 level.
When will the sell-off end?
The three conditions for the sell-off to halt have not yet been fully met. Regarding interest rate hike expectations, the probability of maintaining rates in July and September is significantly higher than that of a hike, but the pricing for a rate hike within the year has not been fully absorbed, as the market continues its expectations game with the Federal Reserve.
In terms of short-term capital liquidation, the scale of net ETF outflows is still expanding, and CFTC speculative net long positions have dropped by nearly 40% from their highs at the beginning of the year; however, it remains unclear whether the retreat is nearing its end.
On the technical front, if gold prices stabilize in the $4,000 to $4,100 range and form a valid technical bullish divergence, an opportunity for market sentiment to recover will gradually emerge.
Overall, until the Federal Reserve's policy meeting in mid-to-late June releases clear policy signals, gold is likely to repeatedly test the bottom within the $4,000 to $4,300 range, waiting for a new equilibrium to be reached in the expectations game between the market and the Fed.
For long-term allocators, the decline in gold prices is gradually digesting previous sentiment bubbles, and the repeated testing of the $4,000 mark may eventually constitute an inflection point where long and short forces shift from liquidation to balance, at which point the market will answer the core question of when the sell-off will stop.
* The content presented above, whether from a third party or not, is considered as general advice only. This article should not be construed as containing investment advice, investment recommendations, an offer of or solicitation for any transactions in financial instruments.


