


USD/CAD Price Forecast: RSI enters overbought territory as bears defend 1.4000
- USD/CAD holds near seven-month highs as lower Oil prices weigh on the Canadian Dollar.
- Overbought signals emerge on the daily chart, but USD/CAD's broader technical outlook remains bullish.
- Bulls face immediate resistance at the 1.4000 psychological mark.
USD/CAD trades on the front foot on Friday as lower Oil prices weigh on the commodity-linked Canadian Dollar (CAD) amid cautious optimism that the United States (US) and Iran could reach an agreement that would reopen the Strait of Hormuz.
At the time of writing, the pair trades around 1.3979 after touching 1.4024 on Thursday, its highest level since November 2025. Meanwhile, West Texas Intermediate (WTI) Crude Oil trades near $83.50 per barrel, near two-month lows.
The Canadian Dollar has remained under steady pressure since early May as geopolitical tensions keep safe-haven flows directed toward the US Dollar (USD). In addition, the relative strength of the US economy and favorable interest rate differentials between the US and Canada remain a key headwind for the Loonie.
However, overbought conditions on the daily chart could limit further upside in the near term. Still, the broader trend remains bullish, with the pair holding comfortably above key moving averages.
Technical Analysis:
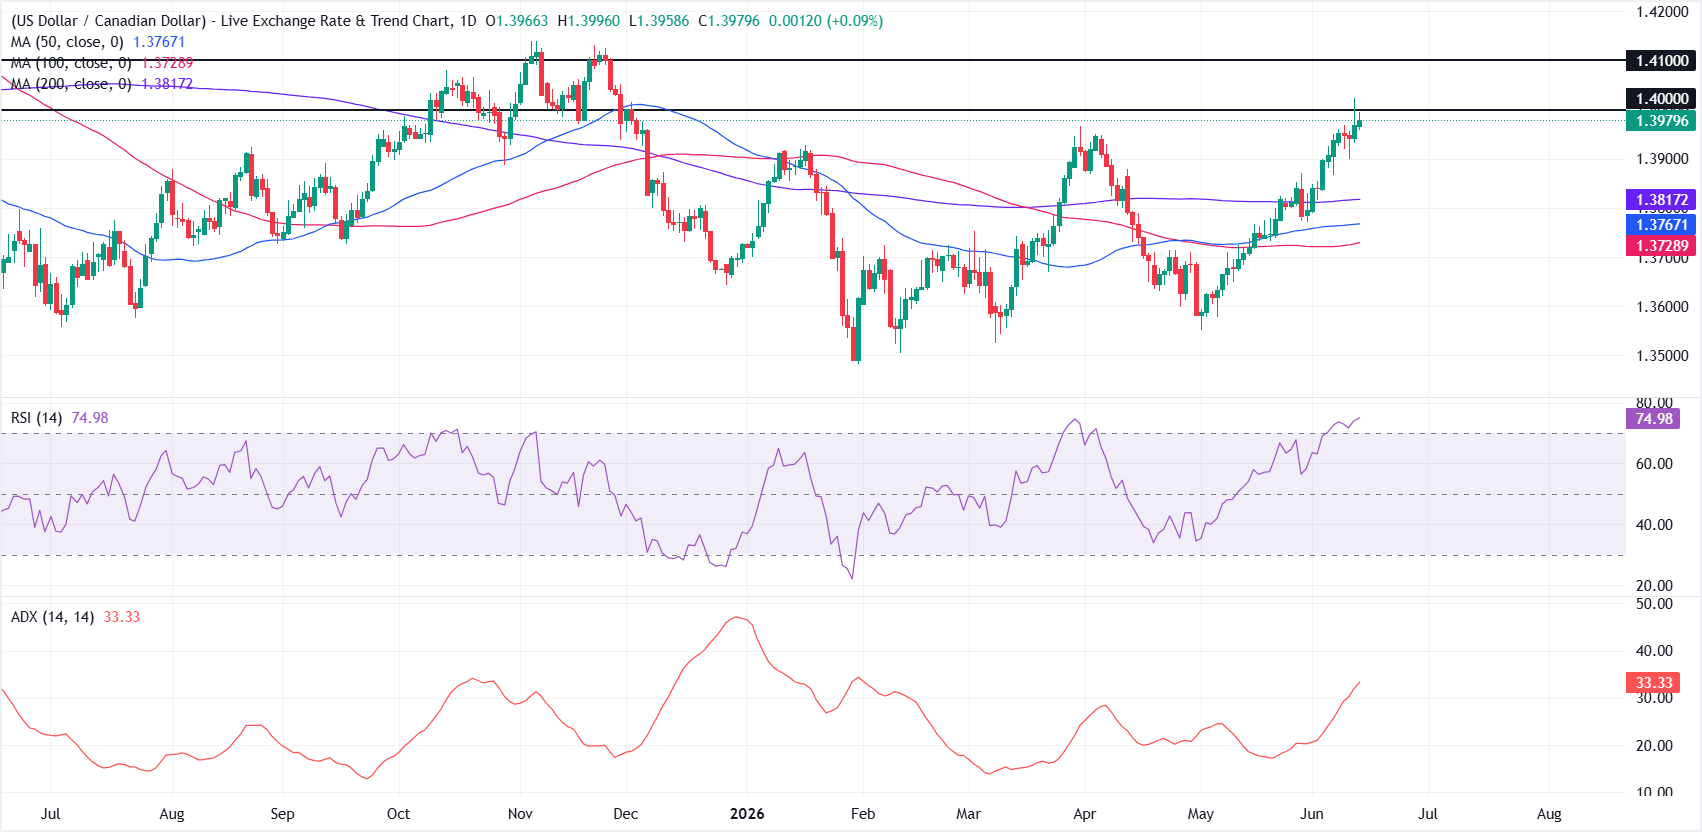
In the daily chart, USD/CAD retains a bullish near-term bias as price holds comfortably above the 50-, 100- and 200-day Simple Moving Averages (SMAs).
The overbought Relative Strength Index (RSI) near 75 and a firming Average Directional Index (ADX) around 33 suggest a strong but stretched uptrend, hinting that upside follow-through may persist while also increasing the risk of a corrective pause.
On the topside, immediate resistance is aligned at the psychological 1.4000 handle, followed by a higher barrier at 1.4100.
On the downside, initial support is seen at the 200-day SMA near 1.3817, ahead of the 50-day SMA around 1.3767 and the 100-day SMA near 1.3729, where dips would be expected to attract buying interest while the broader bullish structure remains intact.
(The technical analysis of this story was written with the help of an AI tool.)
US Dollar Price Today
The table below shows the percentage change of US Dollar (USD) against listed major currencies today. US Dollar was the strongest against the Swiss Franc.
| USD | EUR | GBP | JPY | CAD | AUD | NZD | CHF | |
|---|---|---|---|---|---|---|---|---|
| USD | 0.04% | 0.01% | 0.14% | 0.09% | 0.00% | 0.07% | 0.22% | |
| EUR | -0.04% | -0.03% | 0.11% | 0.06% | -0.02% | 0.03% | 0.18% | |
| GBP | -0.01% | 0.03% | 0.15% | 0.09% | -0.02% | 0.06% | 0.21% | |
| JPY | -0.14% | -0.11% | -0.15% | -0.08% | -0.17% | -0.10% | 0.04% | |
| CAD | -0.09% | -0.06% | -0.09% | 0.08% | -0.09% | -0.03% | 0.13% | |
| AUD | -0.01% | 0.02% | 0.02% | 0.17% | 0.09% | 0.04% | 0.20% | |
| NZD | -0.07% | -0.03% | -0.06% | 0.10% | 0.03% | -0.04% | 0.16% | |
| CHF | -0.22% | -0.18% | -0.21% | -0.04% | -0.13% | -0.20% | -0.16% |
The heat map shows percentage changes of major currencies against each other. The base currency is picked from the left column, while the quote currency is picked from the top row. For example, if you pick the US Dollar from the left column and move along the horizontal line to the Japanese Yen, the percentage change displayed in the box will represent USD (base)/JPY (quote).
Recommended Articles


