


Silver breaks $64 as precious metals rebound — can gold hold the $4,280 line into the Fed decision?

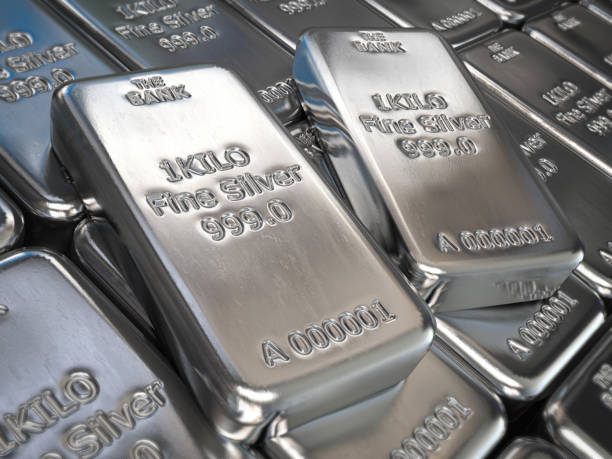
Silver has climbed back above $64 an ounce for the first time this week, leading a broad rebound across precious metals hours before the Federal Reserve delivers what is expected to be its first rate hike since 2023. Spot silver was last at $64.64, up 1.49% on the day, while gold reclaimed $4,300 and platinum and palladium both advanced. The question now is whether the bounce is a genuine turn — or a pause before the Fed's dot plot decides the next move.
The rebound in numbers
Every major metal is higher today:
| Metal | Level (16 Sep, intraday) | Change |
|---|---|---|
| Silver (XAG/USD) | $64.64 | +1.49% |
| Gold (XAU/USD) | $4,328.64 | +0.81% |
| Platinum | ~$1,795 | ~+1% |
| Palladium | ~$1,300 | ~+1% |
| Copper (LME 3-month) | $14,084/t | +$82 |
The move extends into equities: Hong Kong-listed gold miners rallied hard, with Lingbao Gold up as much as 7% and Chifeng Gold up 6-7%, as some funds began positioning for a "sell the rumour, buy the news" outcome on the Fed.
Why now: a fully priced hike and a pause in the dollar
Three forces are behind the bounce.
The hike is already priced. CME FedWatch shows roughly 90% ~ 94.5% odds of a 25bp increase tonight, up from about 59% a week ago. When a move is that fully priced, the marginal seller steps back — and unloved assets like gold, which has fallen more than 3% this month, are the first to catch a bid.
The dollar's advance has stalled. The dollar index is holding near 99.6, below the two-week high of 99.73 touched earlier in the week, and the 10-year Treasury yield has eased back to just under 5% after Tuesday's spike. Gold's two biggest headwinds — a stronger dollar and rising real yields — have both paused.
The physical backdrop hasn't changed. Middle East supply risks are still live, and central-bank demand remains one of the four supports UBS cites for its $5,000 gold target.
Silver: a breakout that needs to hold
Silver's chart offers the cleaner signal. After pulling back to test the $63.40 area — the lower bound of its September range — the metal has pushed back above $64, keeping its higher-lows structure from the July low intact.
The test now is whether this is a real breakout or a head fake:
Support: $63.40 (today's low and the neckline zone), then $62.00 (50-day average area), then $60.00 (round number).
Resistance: $65.00 (round number), then $66.00, then $70.00 (August high zone).
A close above $64.86 (today's high) would confirm the breakout; a failure back below $63.40 would put the $62 neckline back in play — and a break there would open $60 and $55.
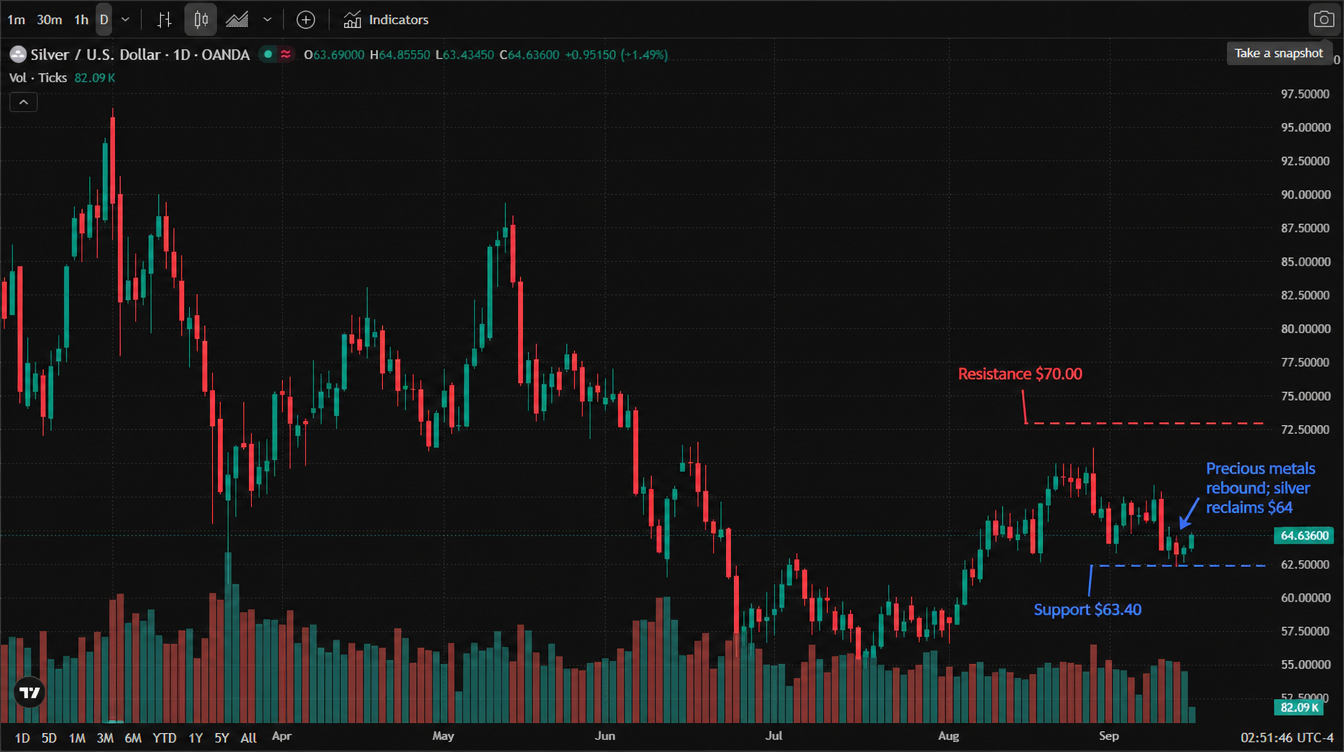
* Chart source: official TradingView chart screenshot, OANDA data feed (XAG/USD), captured 16 September 2026, 2:51 am ET (New York time).
Gold: the $4,280 line is doing the work
Gold's set-up mirrors silver's, with one number mattering more than the rest: $4,280. That zone marks both the September lows and the level the metal held on Monday when it printed a one-month low near $4,260.
Support: $4,270 (September low zone), then $4,200 (August breakout base), then $4,160.
Resistance: $4,341 (today's high), then the $4,400 ~ $4,470 zone (round number and the early-September high), then $4,539 — the 200-day moving average, which IG's Tony Sycamore says must be reclaimed to confirm the correction from the July peak near $4,700 is over.
Sentiment is constructive but not euphoric: a Kitco survey this week found 64% of Wall Street analysts expect higher prices, and UBS reiterated a $5,000 medium-term target.
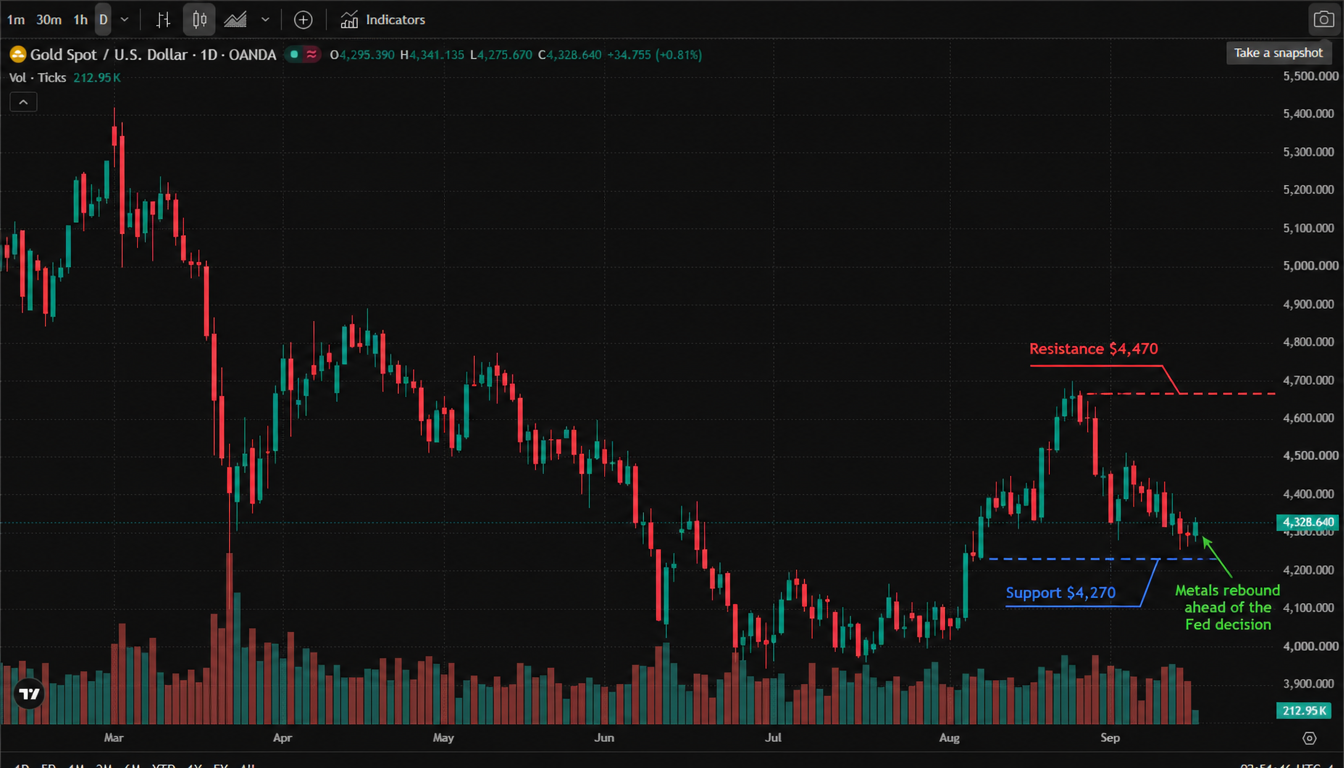
* Chart source: official TradingView chart screenshot, OANDA data feed (XAU/USD), captured 16 September 2026, 2:51 am ET (New York time)
What it means in Australian dollars
For Australian investors, the pullback has been cushioned by the currency: with AUD/USD at 0.7134, gold is worth roughly A$6,070 an ounce at current exchange rates. A dovish dot plot tonight (a median below 4.125% would suggest a one-and-done hike) would weaken the dollar and lift both metals in USD terms; a hawkish set of projections pointing to three hikes would test the supports above — and, for silver, make the difference between a genuine breakout and another failed rally.
Related reads: for the inflation and rate backdrop behind today's move, see Brent tests $108 as a key export pipeline stays shut; for the full market set-up into tonight's decision, see our daily brief.
Read more
Before making any trading decisions, it is important to equip yourself with sufficient fundamental knowledge, have a comprehensive understanding of market trends, be aware of risks and hidden costs, carefully consider investment targets, level of experience, risk appetite, and seek professional advice if necessary.
Furthermore, the content of this article is solely the author's personal opinion and does not necessarily constitute investment advice. The content of this article is for reference purposes only, and readers should not use this article as a basis for any investment decisions.
Investors should not rely on this information as a substitute for independent judgment or make decisions solely based on this information. It does not constitute any trading activity and does not guarantee any profits in trading.
If you have any inquiries regarding the data, information, or content related to Mitrade in this article, please contact us via email: insights@mitrade.com. The Mitrade team will carefully review the content to continue improving the quality of the article.


