


Brent tests $108 as a key export pipeline stays shut — can the rally clear $110?

Brent crude rose 2.55% to $106.97 a barrel on Monday and WTI added 2.32% to $102.30, extending a rally that has already added roughly 9% over the past week. The trigger is physical, not financial: a major regional export pipeline that normally carries about 7 million barrels a day remains shut as a precaution, with no restart timeline, and shipping through the region's main chokepoint is still disrupted.
The market is now asking whether $110 falls next, or whether this is where demand destruction finally catches up.
The move: a second session of supply-driven gains
Monday's session was orderly rather than panicked. Brent opened at $107.11, printed a high of $108.49 and a low of $106.11 before settling back to $106.97. That leaves the benchmark up roughly 77% for the year.
What stands out is where the gains are concentrated. Physical benchmarks have moved further and faster than futures, and the front-month spread has widened to a $5.53 backwardation from $3.84 a week earlier — a market paying up for barrels today rather than later.
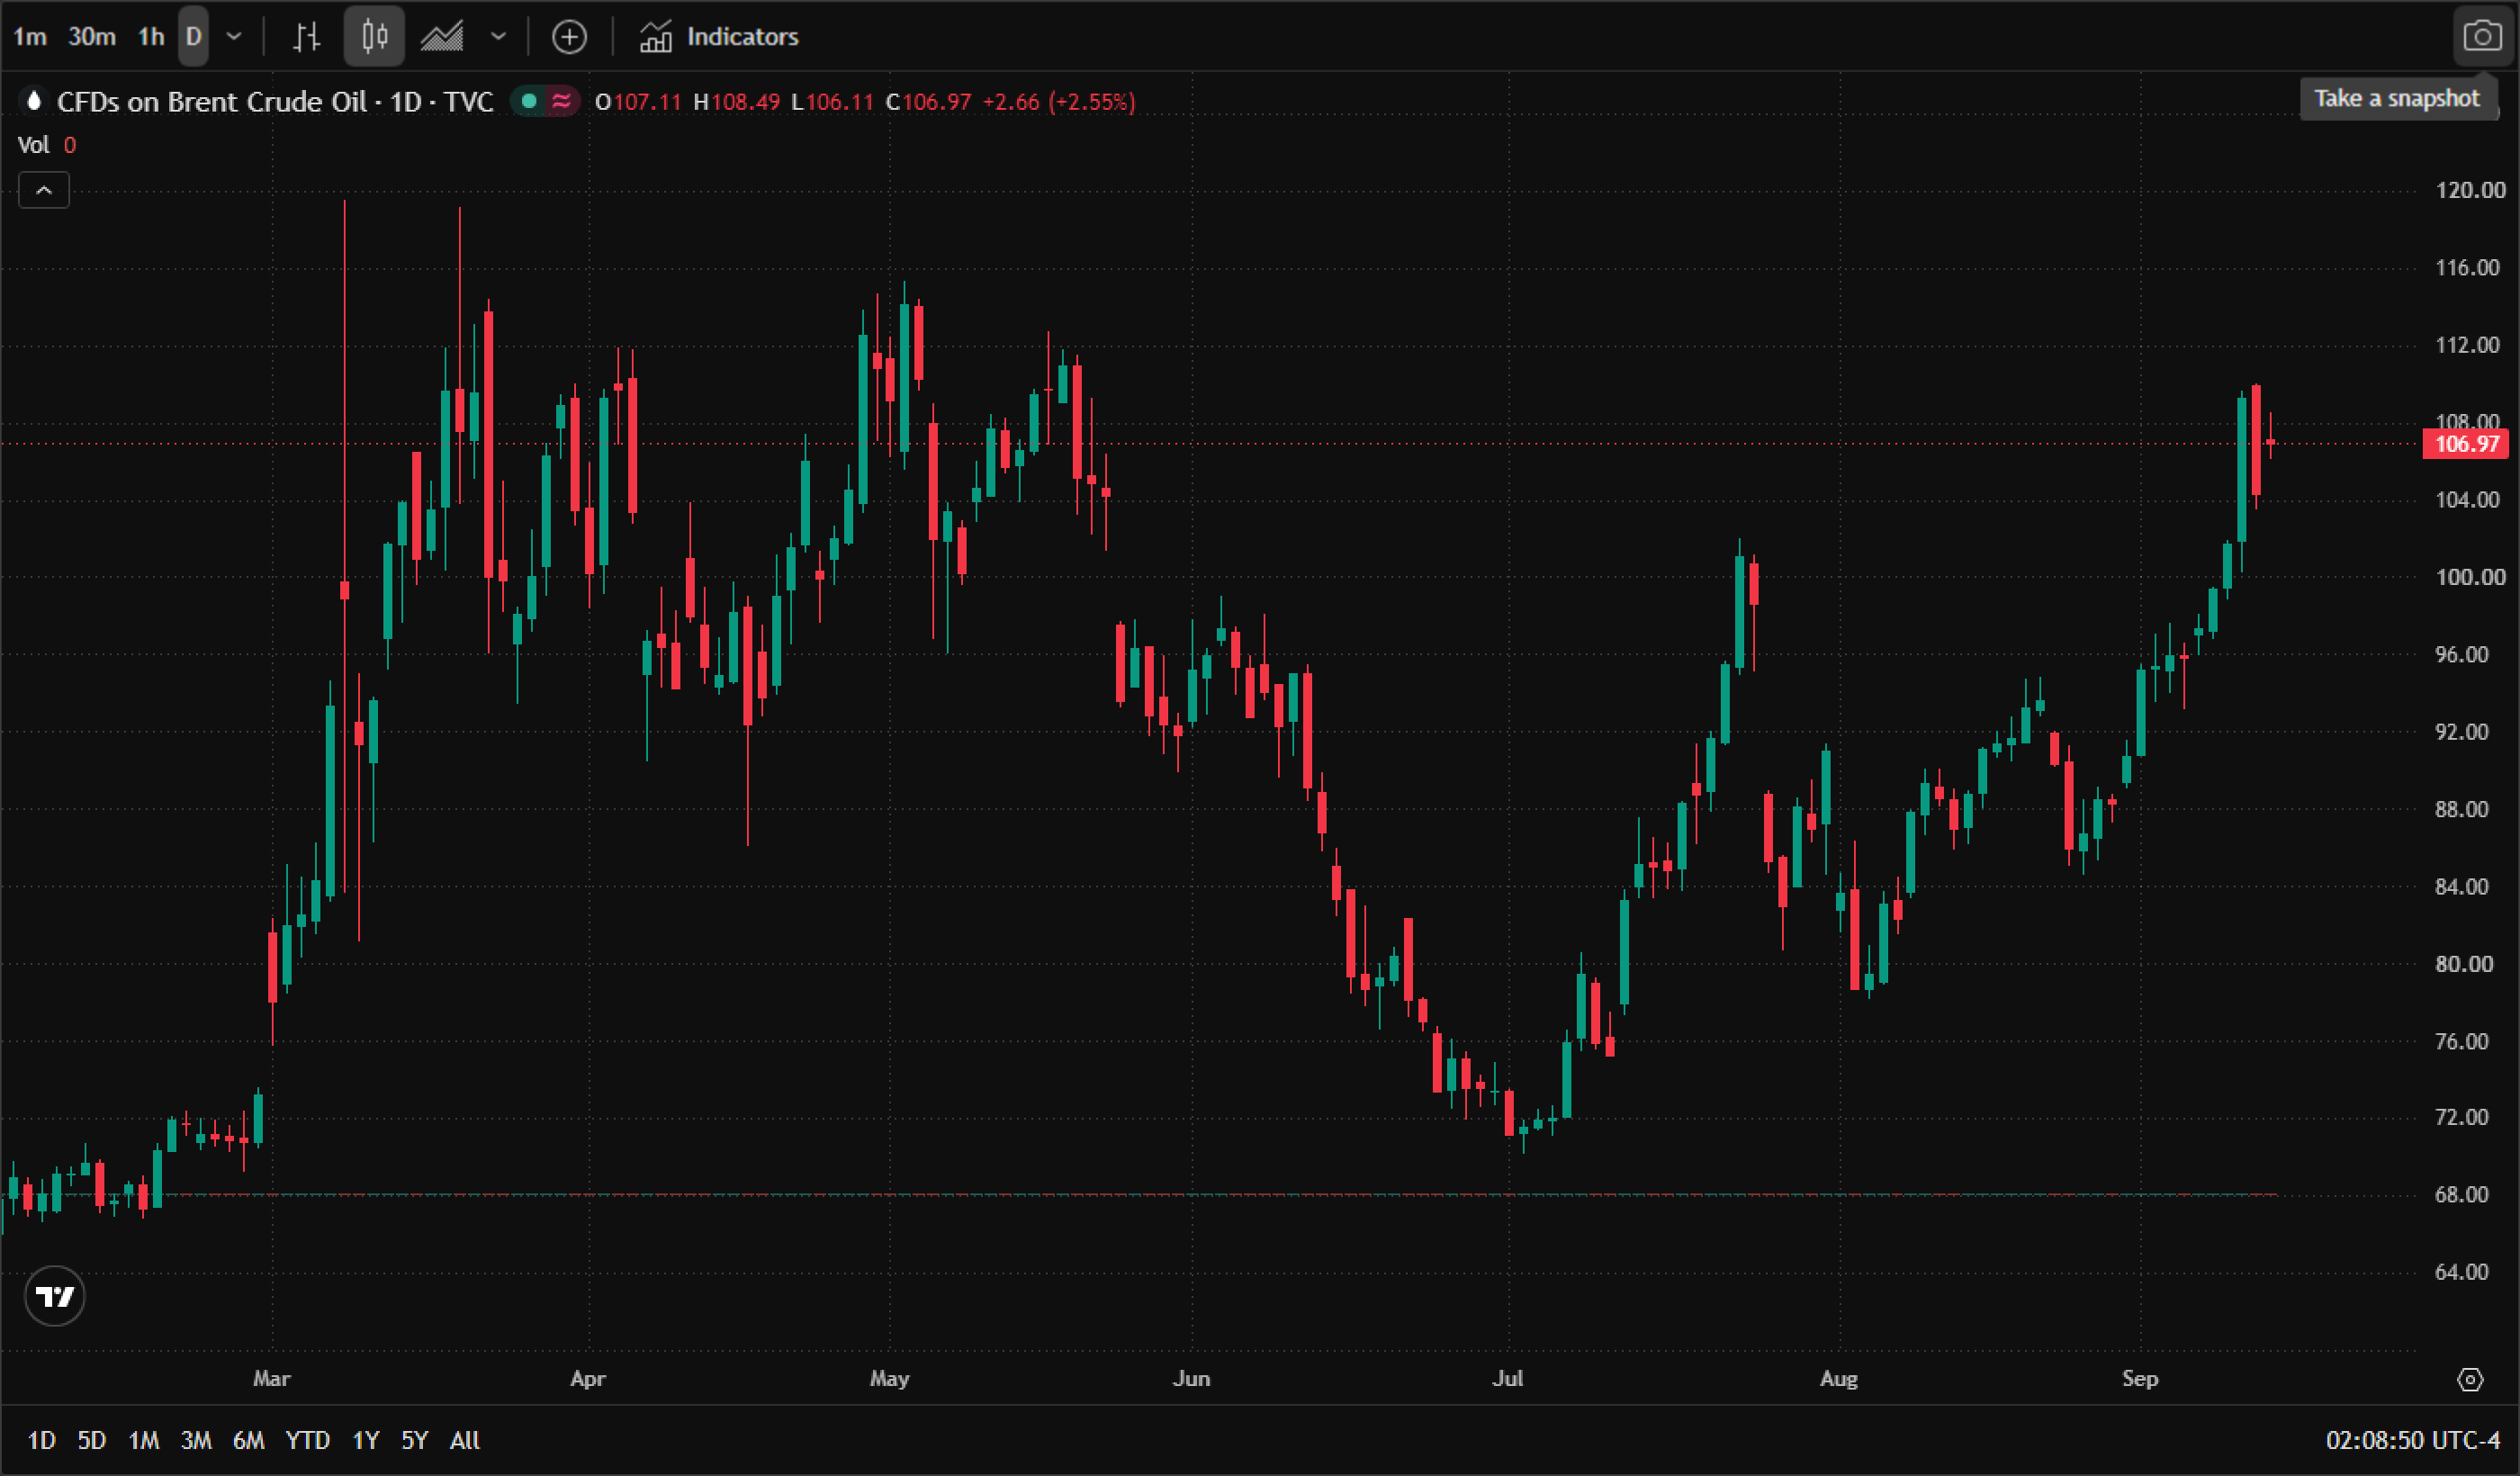
* Chart source: official TradingView chart screenshot, TVC data feed (CFDs on Brent Crude Oil), captured 14 September 2026 at 2:08 am ET.
The supply story: a bypass route is offline
The pipeline that has been shut is the one built specifically to avoid the region's main shipping chokepoint, running from production areas to a Red Sea port. With it offline, barrels that would normally bypass the strait have to travel through it — precisely when shipping through the strait is already constrained.
Analyst commentary has focused on duration rather than the headline event. Sparta Commodities' June Goh notes the impact depends on how long the shutdown lasts: a quick restart could be buffered by inventories at the export terminal, but a prolonged closure risks forcing production cuts.
There is a second front. A meeting intended to discuss a temporary shipping corridor through the strait has been postponed, removing the near-term diplomatic path back to normal flows.
Why the tightness is showing up in spreads, not just price
The clearest evidence of physical scarcity is the curve. A $5.53 backwardation means the market is not pricing a temporary blip — it is pricing barrels it cannot easily replace.
The product side confirms it. Distillate markets have been the tightest part of the barrel all year, and the IEA has flagged refining margins in the Atlantic Basin at record highs. It is product tightness, rather than crude alone, that feeds most directly into headline inflation — which is why this oil move matters for the Fed decision on Wednesday.
Gas is moving with crude
European natural gas has climbed above €82 ~ €83 per MWh, its highest since December 2022, with storage sitting at 68.04% — below normal for the time of year (Germany 55.60%, Netherlands 52.13%). The two markets are now trading the same risk.
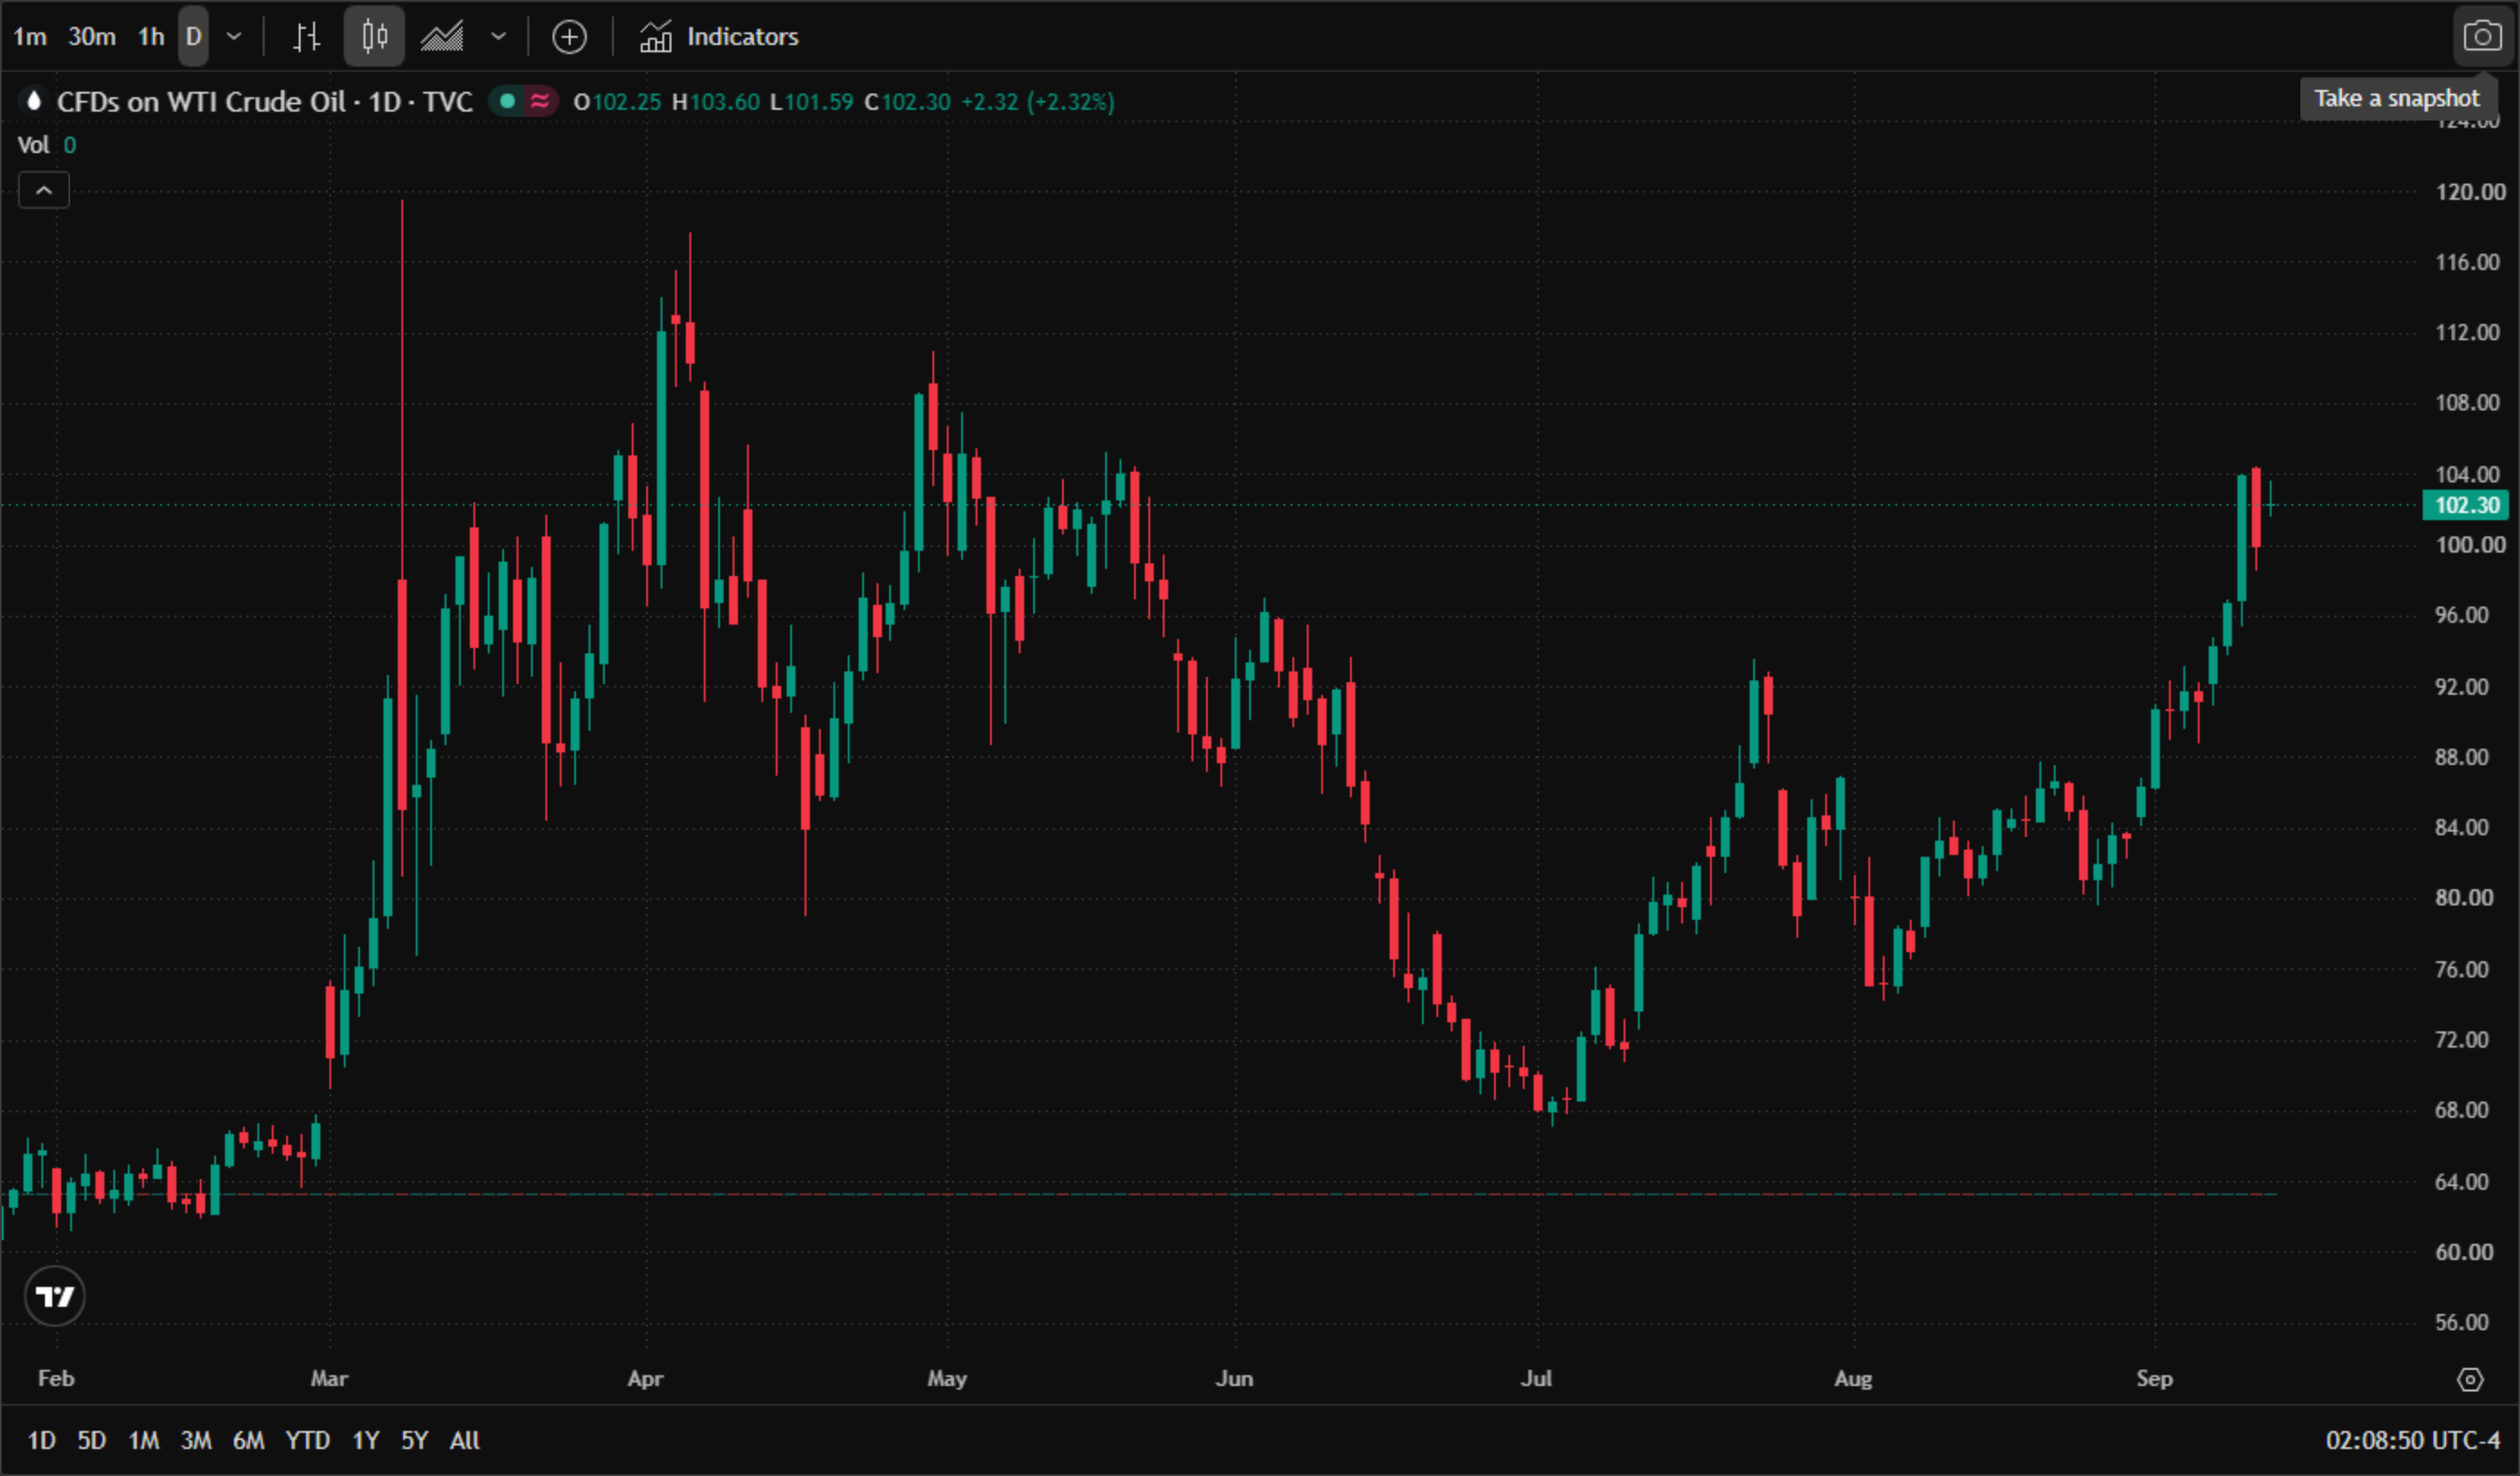
* Chart source: official TradingView chart screenshot, TVC data feed (CFDs on WTI Crude Oil), captured 14 September 2026 at 2:08 am ET.
The bull case and the bear case
The bull case is a duration problem. IG analyst Tony Sycamore has flagged $119.48 as a target if diplomatic talks stall or the pipeline restart is slow. On that view, $110 is simply the next threshold rather than a ceiling, and the backwardation has room to widen further.
The bear case is that high prices are doing the work of supply. At $100-plus, demand destruction is no longer theoretical: Asian importers have been shifting away from spot LNG toward alternatives, and forecasters have already cut 2026 demand estimates. When crude has rallied this far this fast, the marginal buyer tends to disappear rather than chase.
The balanced read: as long as the pipeline stays shut, dips are likely to be bought. A restart announcement — or any sign that talks have resumed — is the single biggest downside risk to the trade, and it can arrive without warning.
Levels to watch
| Support | Resistance |
|---|---|
| $106.11 (Monday's session low) | $108.49 (Monday's session high) |
| $104.00 (prior consolidation ceiling) | $110.00 (next psychological threshold) |
| $100.00 (round number, breakout base) | $119.48 (IG's upside target if talks stall) |
What it means beyond the barrel
For Australian motorists, the pass-through is already in place: fuel costs have been a live input for consumer inflation since the disruption began, and petrol above A$2 a litre has been contributing a meaningful share of household spending growth. That keeps fuel costs relevant to RBA policy, which meets on 29 September with markets pricing roughly a 69% ~ 76% chance of a hike to 4.60%.
For traders, the setup is a market priced for scarcity but with an unusually binary catalyst: the pipeline restart. Hold above $106 and the path toward $110 stays open; lose $104 and the demand-destruction argument regains the upper hand.
Related reads: for how the energy shock is feeding into the Fed decision, see Fed hike odds near 90% into Wednesday's decision; for the previous instalment of this story, see Brent holds above $100 as tanker attacks tighten supply.
Read more
Before making any trading decisions, it is important to equip yourself with sufficient fundamental knowledge, have a comprehensive understanding of market trends, be aware of risks and hidden costs, carefully consider investment targets, level of experience, risk appetite, and seek professional advice if necessary.
Furthermore, the content of this article is solely the author's personal opinion and does not necessarily constitute investment advice. The content of this article is for reference purposes only, and readers should not use this article as a basis for any investment decisions.
Investors should not rely on this information as a substitute for independent judgment or make decisions solely based on this information. It does not constitute any trading activity and does not guarantee any profits in trading.
If you have any inquiries regarding the data, information, or content related to Mitrade in this article, please contact us via email: insights@mitrade.com. The Mitrade team will carefully review the content to continue improving the quality of the article.


