


US GDP grew 3.4% and core PCE held at 3.1% — December is now a hike trade, not a cut trade


Mitrade Insights — The US economy grew 3.4% annualised in Q3, above the 3.1% consensus and well ahead of Q2's 2.2%. The same morning, September headline PCE accelerated to 3.6% year on year from 3.4%, and core PCE held at 3.1%, the highest since May. Initial jobless claims fell to 194,000, near levels last seen in the late 1960s. The Fed held at 3.75%–4.00% on October 28 with two dissents in favour of a hike; December is now priced at roughly 90%. The question is no longer whether the Fed can cut. It is whether the composition of this growth gives it room to stop.
| Metric | September / Q3 | Previous | What it tells you |
|---|---|---|---|
| Q3 GDP (annualised) | +3.4% | +2.2% (Q2) | Above the 3.1% consensus; a 3%-plus run rate for the first time in a year |
| Headline PCE (y/y) | 3.6% | 3.4% | Energy is the main driver, not demand |
| Core PCE (y/y) | 3.1% | 3.0% | Highest since May; still 1.1 points above target |
| Headline PCE (m/m) | +0.5% | +0.3% | Largest monthly gain since March |
| Core PCE (m/m) | +0.3% | — | In line with consensus |
| Initial claims | 194,000 | 200,000 estimate | The labour market is not cracking |
| Fed funds target | 3.75%–4.00% | — | Held 10–2 on October 28 |
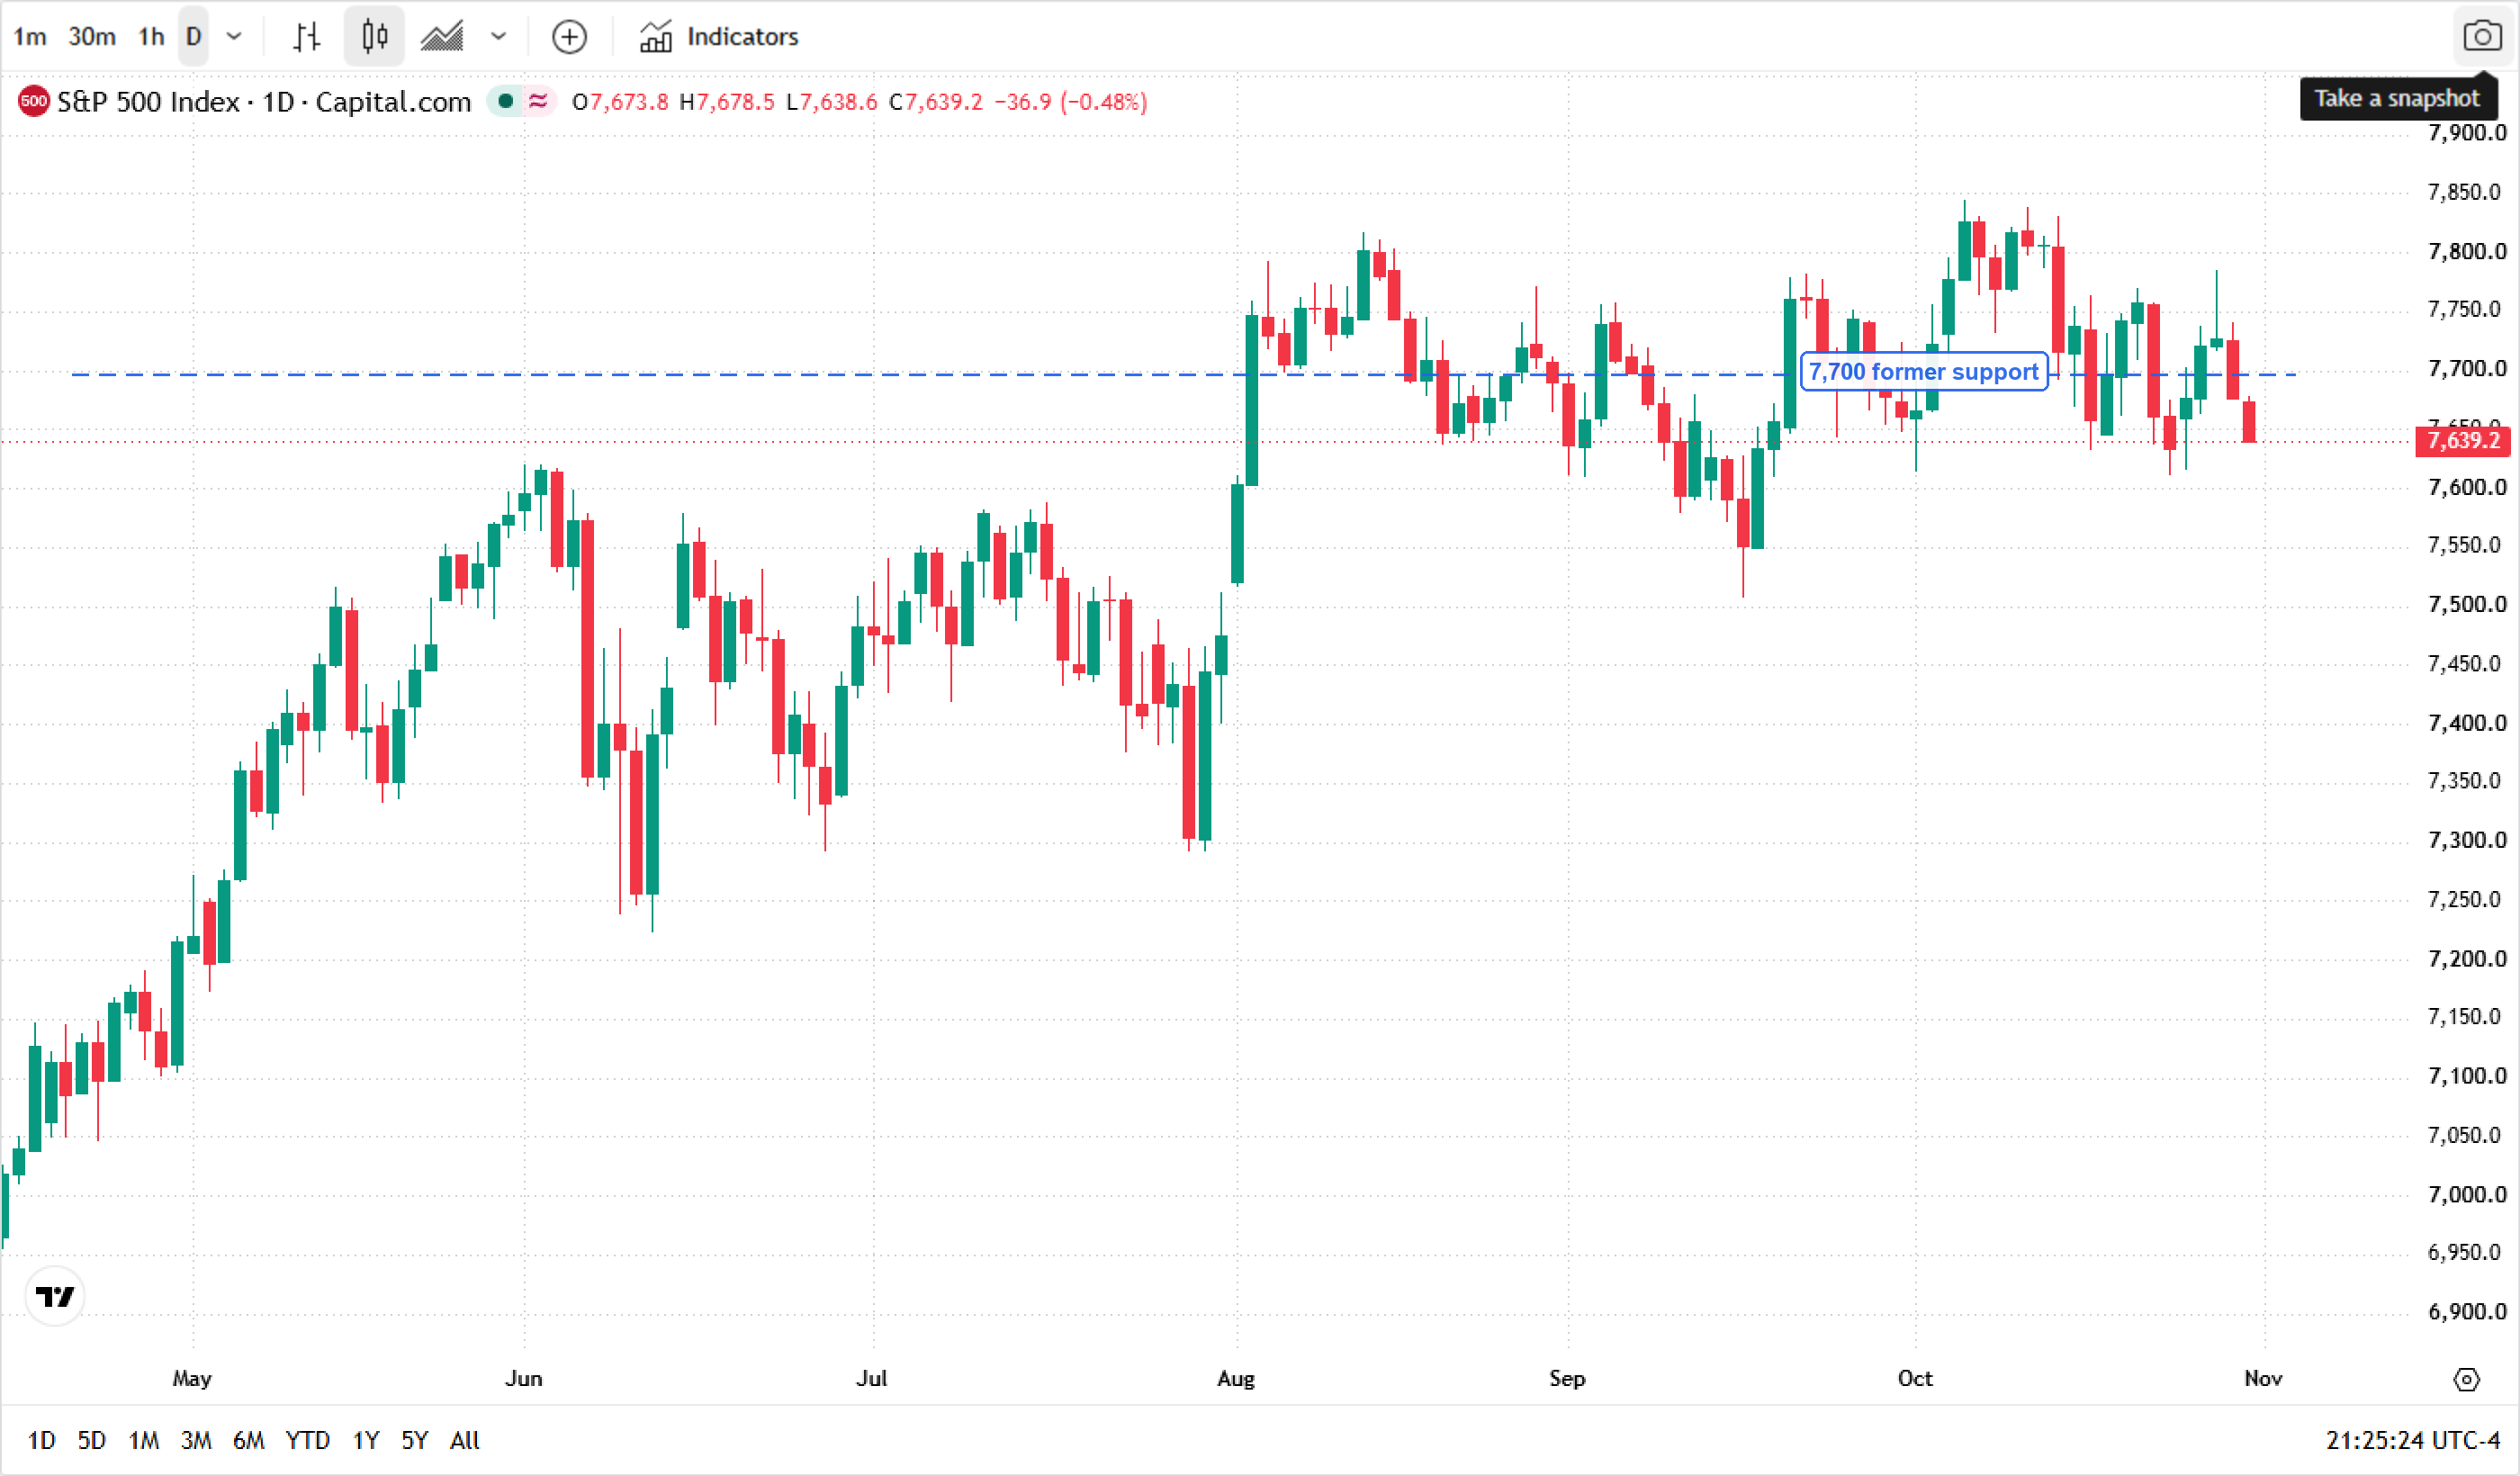
* Chart source: TradingView (US500 daily).
3.4% is not the number the Fed is watching
The headline is strong, but the Fed does not set policy on the headline. The composition is where the story is.
1.6 points came from inventories
About 1.6 percentage points of the 3.4% came from inventory building, and net exports subtracted 3.3 points. Strip those out and real final sales to private domestic purchasers — the Fed's preferred proxy for underlying demand — rose 4.9%, up from 4.6% in Q2. That is still firm. But it also means the economy produced more than it sold, which is not a repeatable growth engine.
The 19.4% investment boom is AI capex.
Gross private domestic investment rose 19.4%, driven by a 20.9% surge in equipment spending and an 8.4% increase in intellectual property products. This is the AI build-out showing up in GDP. It is real, and it is inflationary in the short run: servers, power, construction and skilled labour all compete for the same capacity. The same capex is also why Alphabet and Amazon are burning cash — a theme that hit the Nasdaq on October 29.
3.6% headline, 3.1% core: energy is doing the damage
September's price increase was not broad-based. Energy goods and services jumped 5.4%, with gasoline up 9.2%. Services excluding energy and housing rose 0.4%, and housing rose 0.3%. In other words, the oil shock is doing most of the work.
Gasoline +9.2%, services ex-energy/housing +0.4%
That matters for the Fed's reaction function. An energy-driven inflation print is usually treated as a supply shock: the Fed can look through it if expectations stay anchored. But with core at 3.1% and headline at 3.6%, the Fed cannot claim the job is done. The longer oil stays above $100, the more likely energy bleeds into wages and services.
The 10-year fell to 4.93% — the bond market sees a slowdown.
The bond market's reaction was the opposite of the equity market's. The 10-year yield fell to 4.93% from 5.05% on October 29, even as GDP beat. That is not a growth scare; it is a signal that the market thinks the Fed's hiking cycle is near its end, and that the inventory and capex boost will fade. The dollar also softened, with DXY at 101.64, down from 102.49 on October 28.
December is 90% priced; the next three prints decide the rest
The Fed's next meeting is December 8–9. Between now and then, three prints matter: November 6 payrolls, November 10 CPI, and the November 25 PCE. If payrolls cool and CPI prints below 3.5%, the December hike can be priced out. If they do not, the market's 90% is not a ceiling.
Nov 6 payrolls, Nov 10 CPI, Dec 8–9 FOMC.
The base case is a 25bp hike in December to 4.00%–4.25%. The alternative is a hold, but the Fed would need a clear labour-market crack to justify it. Claims at 194,000 are not that crack.
What would make the Fed hold
Three things: payrolls below 50,000, core CPI below 3.0% on a monthly basis, and oil back below $90. None of them is in the current data. That is why the market is pricing a hike, not a cut.
| Scenario | Fed path | 10-year | S&P 500 |
|---|---|---|---|
| Core PCE stays at 3.1%, payrolls firm | December hike; 2027 terminal near 4.5% | 5.00%–5.15% | 7,600–7,700 range; valuation compression |
| Payrolls cool below 50k, CPI softens | December hold; cut talk returns | 4.70%–4.85% | Reclaim 7,800; breadth improves |
| Oil above $120, core PCE rises to 3.3% | Two hikes priced; 2027 terminal above 4.75% | 5.20%+ | 7,500 test; defensive rotation |
The bottom line: 3.4% growth is not the all-clear. It is a growth mix tilted toward inventories and AI capex, with an energy-driven inflation print on top. The Fed's next move is a hike until the labour market or oil says otherwise. For traders, the line to watch is 7,700 on the S&P 500: the cash index closed above it on October 29, but the futures are already below it.
Read more
Before making any trading decisions, it is important to equip yourself with sufficient fundamental knowledge, have a comprehensive understanding of market trends, be aware of risks and hidden costs, carefully consider investment targets, level of experience, risk appetite, and seek professional advice if necessary.
Furthermore, the content of this article is solely the author's personal opinion and does not necessarily constitute investment advice. The content of this article is for reference purposes only, and readers should not use this article as a basis for any investment decisions.
Investors should not rely on this information as a substitute for independent judgment or make decisions solely based on this information. It does not constitute any trading activity and does not guarantee any profits in trading.
If you have any inquiries regarding the data, information, or content related to Mitrade in this article, please contact us via email: insights@mitrade.com. The Mitrade team will carefully review the content to continue improving the quality of the article.


