


USD/JPY Price Forecast: Bullish pin bar faces 200-day SMA wall
- USD/JPY forms potential bullish pin bar below 200-day SMA resistance.
- RSI remains bullish but turns lower, signaling fading buying momentum.
- Break above 159.00 exposes 159.16, while losing 157.39 threatens 156.08.
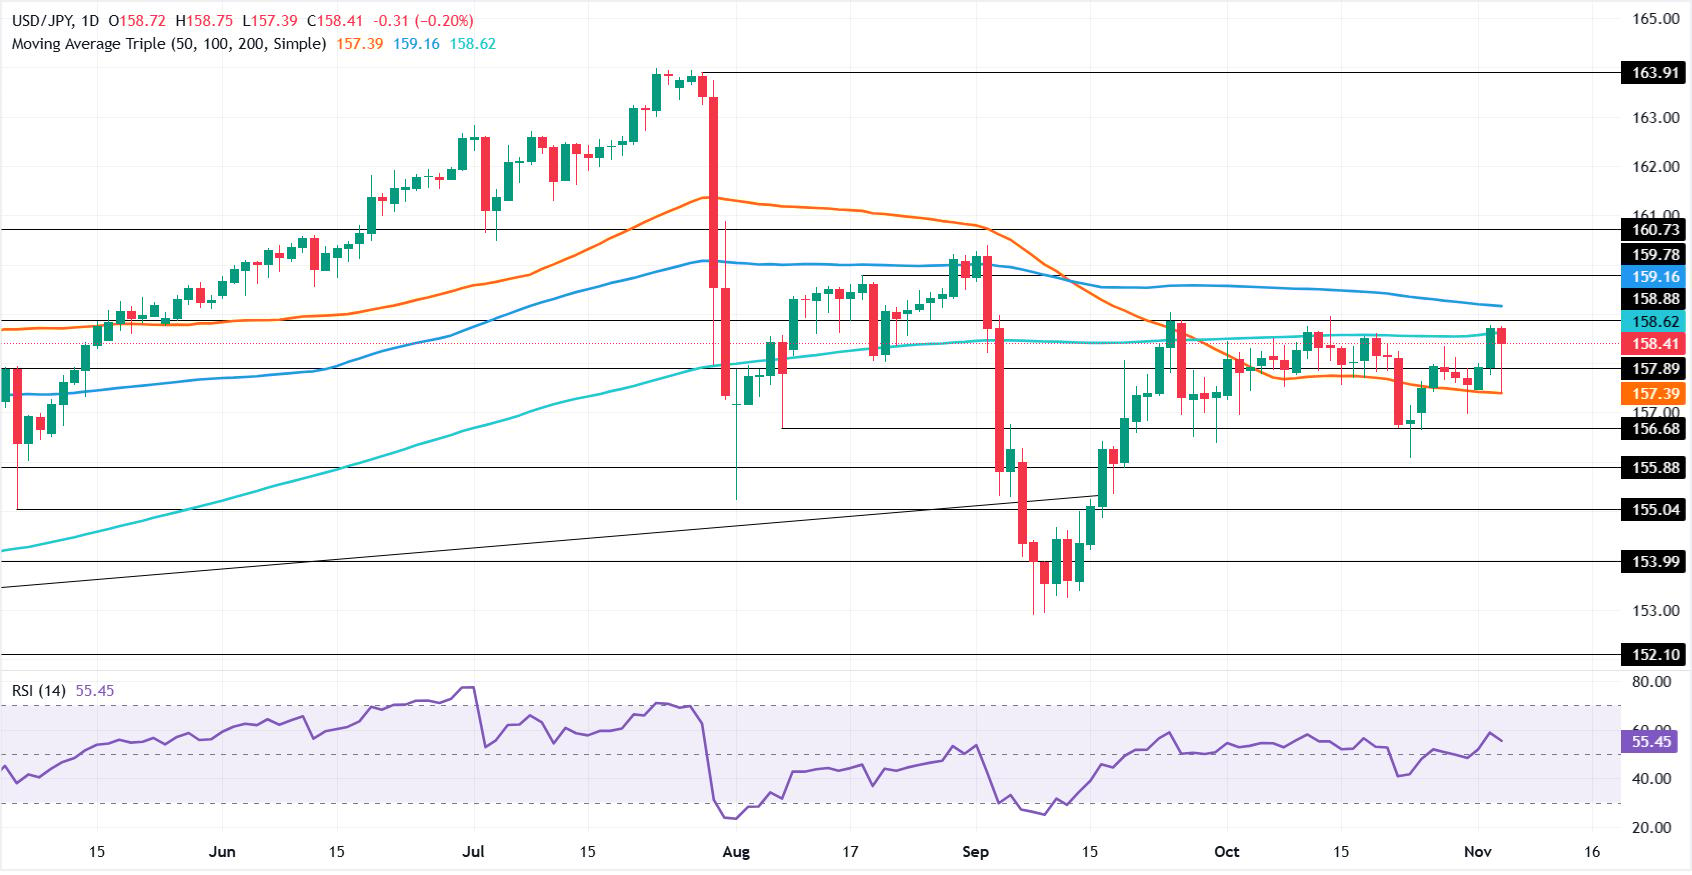
The USD/JPY edges lower but trims some of its earlier losses, down 0.20% in the aftermath of the US midterm election results. However, the pair seems to form a tilted bullish ‘pin bar ’, yet it remains consolidated within the 50- and 200-day SMAs, each at 157.39 and 158.62. At the time of writing, the pair trades at 158.41.
USD/JPY Price Forecast: Technical outlook
The USD/JPY remains subdued, with no clear bias. The market structure of lower highs and lower lows remains intact, but if buyers reclaim 159.00, a move to the 100-day SMA at 159.16 is on the cards, with buyers eyeing a test of 160.00.
From a momentum standpoint, that move seems remote. The Relative Strength Index (RSI), although bullish, is aiming downwards. Still, if USD/JPY clears 160.00, buyers could negate the bearish market structure on a breakout of the September 2 high of 160.39.
On the other hand, for a bearish continuation, sellers must drag the USD/JPY below 158.00 and clear the 50-day SMA at 157.39. A breach of the latter will expose 157.00, with sellers setting their sights on the October 23 low of the day (LOD) at 156.08.
USD/JPY Price Chart – Daily
Japanese Yen Price Today
The table below shows the percentage change of Japanese Yen (JPY) against listed major currencies today. Japanese Yen was the strongest against the US Dollar.
| USD | EUR | GBP | JPY | CAD | AUD | NZD | CHF | |
|---|---|---|---|---|---|---|---|---|
| USD | -0.37% | -0.44% | -0.21% | -0.27% | -0.54% | -0.22% | -0.52% | |
| EUR | 0.37% | -0.06% | 0.20% | 0.13% | -0.16% | 0.20% | -0.15% | |
| GBP | 0.44% | 0.06% | 0.23% | 0.17% | -0.10% | 0.23% | -0.09% | |
| JPY | 0.21% | -0.20% | -0.23% | -0.07% | -0.34% | -0.03% | -0.33% | |
| CAD | 0.27% | -0.13% | -0.17% | 0.07% | -0.27% | 0.04% | -0.26% | |
| AUD | 0.54% | 0.16% | 0.10% | 0.34% | 0.27% | 0.32% | 0.02% | |
| NZD | 0.22% | -0.20% | -0.23% | 0.03% | -0.04% | -0.32% | -0.29% | |
| CHF | 0.52% | 0.15% | 0.09% | 0.33% | 0.26% | -0.02% | 0.29% |
The heat map shows percentage changes of major currencies against each other. The base currency is picked from the left column, while the quote currency is picked from the top row. For example, if you pick the Japanese Yen from the left column and move along the horizontal line to the US Dollar, the percentage change displayed in the box will represent JPY (base)/USD (quote).
Recommended Articles


