


Binance replaced 95% of a $6.3bn hole — Bitcoin is trading the plumbing, not the coin

Mitrade Insights — On October 29, about $6.3bn left Binance wallets across roughly ten blockchains in around 20 minutes — the largest crypto theft on record. Binance froze deposits and withdrawals on October 30, then began restoring them on November 1 at 06:00 GMT. In the first 9.5 hours, users withdrew $4.64bn and deposited $1.01bn, a net outflow of $3.64bn, or about 2.1% of the exchange's $171bn in assets. Binance says it has replaced 95% of the stolen assets, roughly $6bn, using its $1bn SAFU fund, the futures insurance fund and corporate treasury; about $3bn has been frozen or recovered. Bitcoin fell to 76,173 during the freeze and is now 78,473 (+0.31%). The coin is not trading on the hack. It is trading on the hole — and the hole is almost filled.
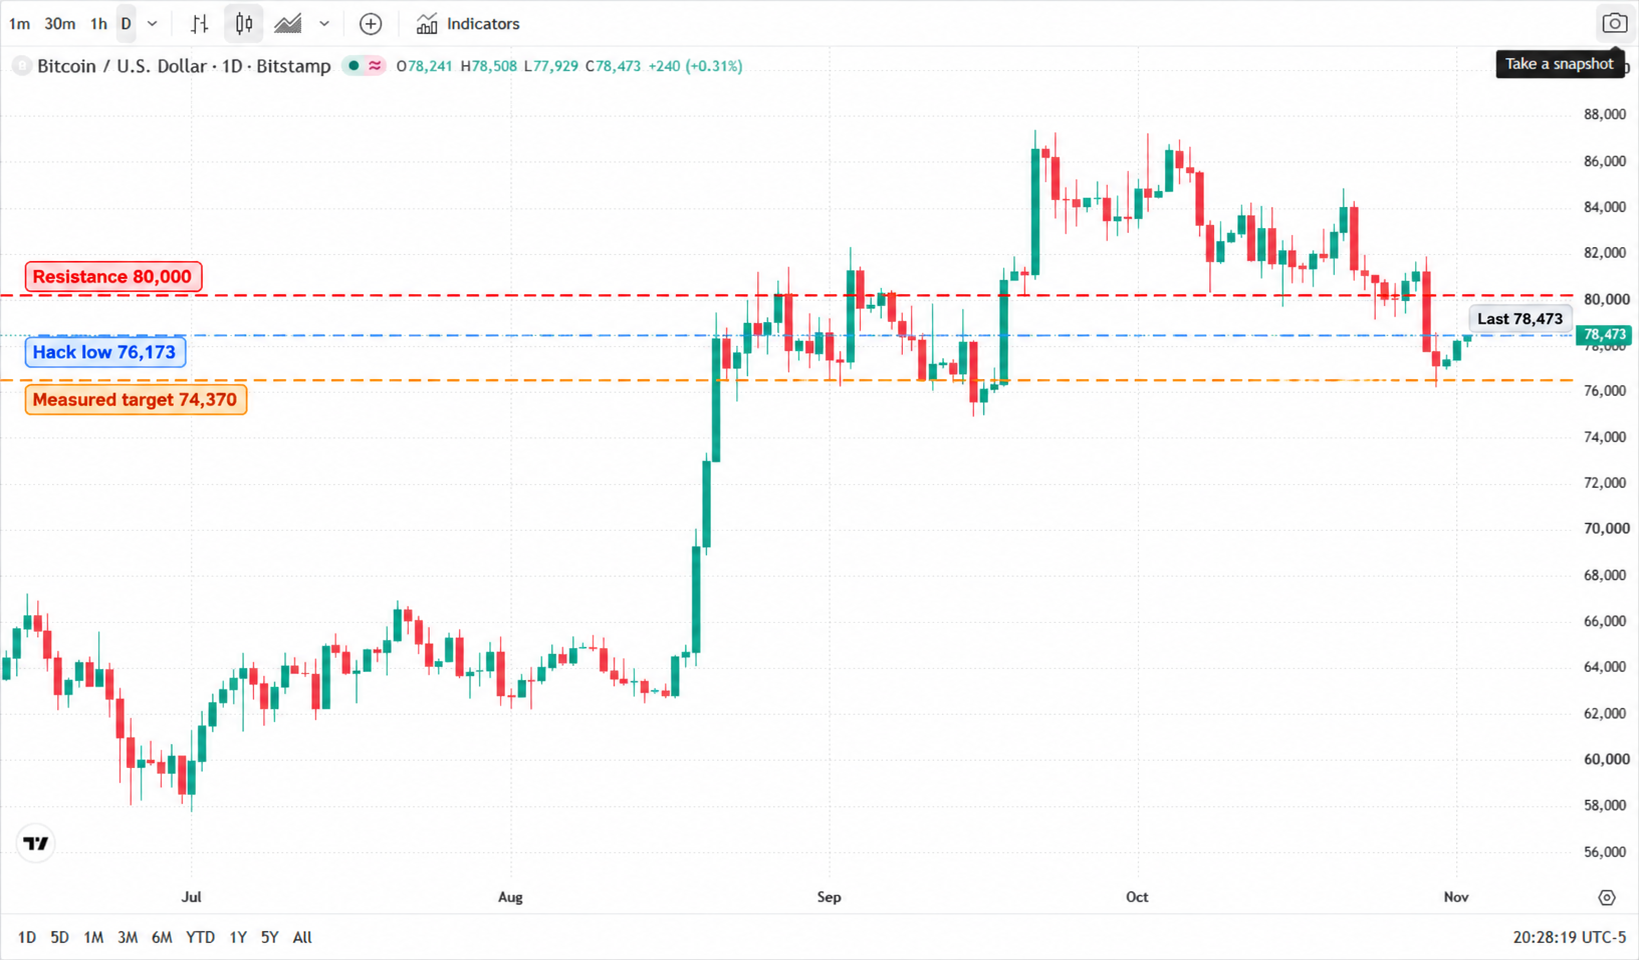
* Chart source: TradingView (BTCUSD daily).
Oct 29 to Nov 1: three days, three different markets
The price action makes more sense as a sequence than as a single event.
Oct 29–30: the hole was unknown
When withdrawals are frozen, the market cannot tell a technical failure from a balance-sheet failure. That uncertainty is why Bitcoin fell to 76,173 and why more than $1.5bn of leveraged positions were liquidated. The coin was not falling because 18,270 BTC had been stolen — that is roughly 0.09% of the 19.9m supply. It was falling because nobody knew whether the exchange could cover the hole.
Nov 1: the hole got a number
The reopening produced the first hard number. A net $3.64bn left in 9.5 hours. That sounds large, but it is 2.1% of assets. A bank run that removes 2% of deposits in a day is a stress event, not a solvency event. Binance also said it had already replaced 95% of the stolen assets, with $6.34bn set aside. The market re-priced from "unknown hole" to "known, covered hole" — and Bitcoin bounced.
Nov 3: the hole gets an audit
The next marker is the updated proof of reserves, expected around November 3. Until then, the 95% claim is a company statement, not an audited fact. That is the difference between a liquidity event and a trust event.
What the market is actually pricing
Three lines matter, and they are not equally important.
| Metric | Value | What it tells you |
|---|---|---|
| Stolen assets | ~$6.3bn | Record size; ~18,270 BTC, $1.66bn USDT, ~$800m USDC |
| Replaced | 95% ($6bn) | SAFU $1bn + futures insurance + treasury |
| Frozen / recovered | ~$3bn | Tether $1.567bn, Circle $800m+, Ripple $200m |
| Net outflow on day one | $3.64bn | 2.1% of $171bn assets |
| BTC stolen vs supply | ~0.09% | 18,270 BTC out of ~19.9m |
| Liquidations | >$1.5bn | Leverage, not spot supply |
The coin-supply line is the least important
18,270 BTC is a rounding error against the total supply. Even if every stolen coin were sold into the market, it would not explain a 5% move. The move came from the exchange layer: frozen withdrawals, uncertain coverage, and forced deleveraging. That is why BNB fell harder than BTC during the freeze — the market was pricing the venue, not the asset.
The liquidity line is the one that mattered
The $3.64bn net outflow is the number to keep. It is large in dollars and small in percentage terms. If the next few days show outflows fading, the liquidity event is over. If they accelerate, the market will start asking whether 2.1% was the first tranche or the whole run.
80,000 is resistance, 76,173 is the test, 74,370 is the measure
The technical map has not changed much since the October double top.
| Level | Price | What it means |
|---|---|---|
| Resistance | 80,000 | Former support; reclaiming it would neutralise the breakdown |
| Spot | 78,473 | Between the hack low and resistance |
| Hack low | 76,173 | The level the freeze tested |
| Measured target | 74,370 | Double-top target from the September 21 / October 2 highs, neckline 80,867 |
The double top at 80,867 was the map before the hack; the hack simply accelerated the move to its measured target zone. A close below 76,173 would open 74,370. A reclaim of 80,000 would say the exchange story is fully priced.
Why 80,000 matters more than 76,173
76,173 is a low, not a level. 80,000 is where the market previously voted on the exchange risk — it broke on the news, and it will be the first test of whether the market believes the 95% coverage claim. The recovery is not confirmed until 80,000 is reclaimed.
What to watch: proof of reserves, netflows, exchange spreads
Three checks over the next 72 hours:
Proof of reserves (Nov 3): does it cover the 5% of assets Binance says are lower-liquidity tokens, and is it audited rather than self-reported?
Daily netflows: does the $3.64bn day-one outflow fade, or accelerate? A second 2% day would change the story from liquidity to solvency.
Exchange spreads: does BNB or BTC trade at a wider discount on Binance than on other venues? A persistent discount is the market's real-time verdict on the hole.
Read more
Before making any trading decisions, it is important to equip yourself with sufficient fundamental knowledge, have a comprehensive understanding of market trends, be aware of risks and hidden costs, carefully consider investment targets, level of experience, risk appetite, and seek professional advice if necessary.
Furthermore, the content of this article is solely the author's personal opinion and does not necessarily constitute investment advice. The content of this article is for reference purposes only, and readers should not use this article as a basis for any investment decisions.
Investors should not rely on this information as a substitute for independent judgment or make decisions solely based on this information. It does not constitute any trading activity and does not guarantee any profits in trading.
If you have any inquiries regarding the data, information, or content related to Mitrade in this article, please contact us via email: insights@mitrade.com. The Mitrade team will carefully review the content to continue improving the quality of the article.


