


The Dow's 1,569-point day was a rotation, not a breakout


Mitrade Insights — The Dow closed 1,569.40 points higher at 53,356.12 on Nov 4, up 3.03%. That was its best post-midterm session in 44 years. The Nasdaq Composite rose 1.44%. Two indices, one session, 1.59 percentage points apart — and that spread, not the point gain, is the actual news.
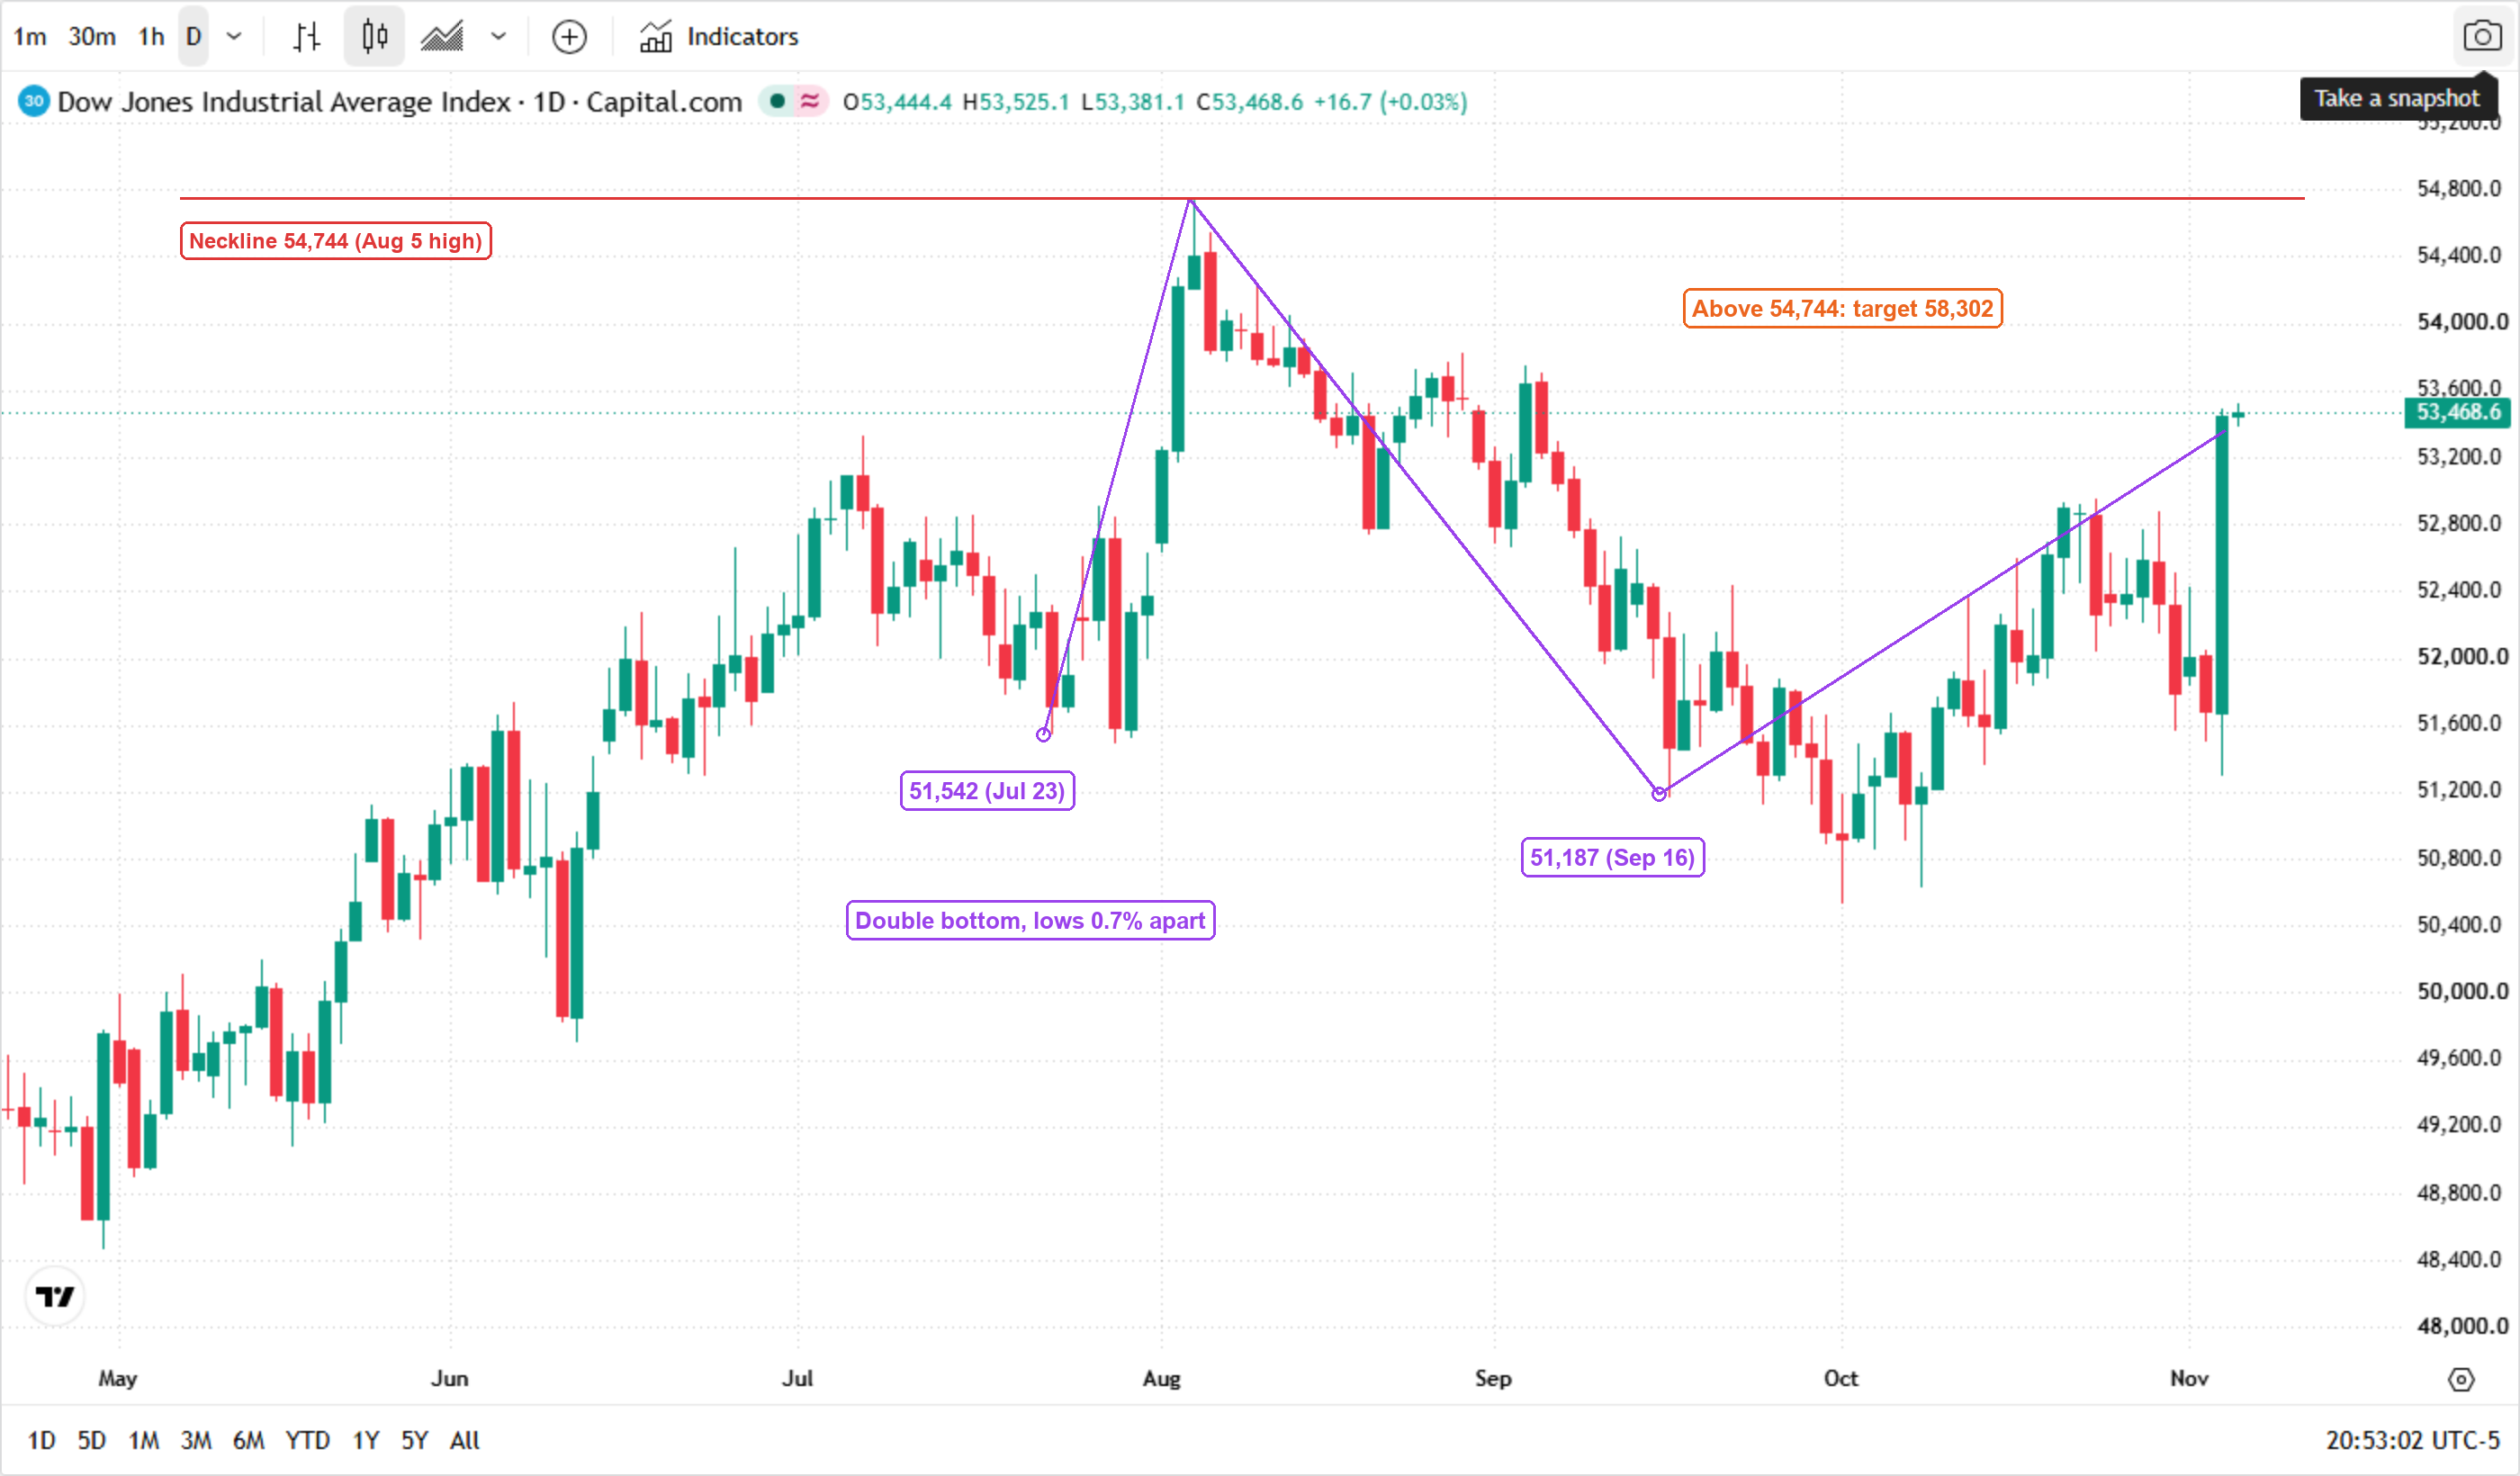
* Chart source: TradingView (US30, daily)
Read the chart where the two circles are. The Dow made a low of 51,542.06 on Jul 23 and a second low of 51,186.67 on Sep 16 — 0.7% apart, with the August 5 peak at 54,744.33 in between. That is a textbook double bottom, and it is unfinished: the index is still 2.54% below the neckline.
The 1.59-point spread is the whole story
Before the vote, the divergence was already extreme. Citadel Securities tracked the equal-weight S&P 500 against the Nasdaq 100 over the 20 sessions through Nov 2: the equal-weight index gained more than 4% while the Nasdaq 100 fell roughly 10%. A 14-point gap, in the 99th percentile of history.
That matters for how you read Nov 4. A 14-point divergence does not get resolved in one afternoon. What happened instead is that the two sides moved toward each other from a stretched position — the cheapest part of the market got bid, the crowded part did not.
Banks bid, chips capped
The KBW Nasdaq Bank Index rose 2.43% to 177.54. The VIX fell 20.26% to 16.61. The 10-year yield dropped 5.8 basis points to 4.894%, still below its October 7 cycle high of 5.36%. Lower yields plus a lower volatility premium is the specific combination that lets financials and cyclicals re-rate without new economic data.
Meanwhile, AI-linked technology traded under pressure on data-centre regulation headlines — the same group that had carried the index higher for most of 2026 was the funding source for the rotation, not the destination.
The strongest counter-argument
The Dow is price-weighted. A handful of high-priced constituents can move 1,500 points without broad participation, and the S&P 500's 1.58% gain — a little more than half the Dow's — is exactly what that arithmetic looks like. If this were a genuine broad re-rating, the equal-weight index should have outrun the cap-weighted one by a wide margin on the day. It did not.
54,744 is the only print that matters
Three months after setting its 52-week high, the Dow is still below it. And because that high is also the neckline of the double bottom, one level does two jobs.
| Index | Nov 4 close | 1-day change | Distance to 52-week high |
|---|---|---|---|
| Dow Jones Industrial Average | 53,356.12 | +3.03% | −2.54% (54,744.33, Aug 5) |
| S&P 500 | 7,688.62 | +1.58% | −1.99% (7,844.52, Oct 6) |
| Nasdaq Composite | 25,736.51 | +1.44% | −7.16% (27,722.75, Oct 6) |
The measured target on a confirmed break is 58,301.98 — the height of the pattern added to the neckline. It is not active yet, and the distinction is not academic: a price that fails at 54,744 would leave the Sep 16 low as just another lower high in a market that peaked in August.
Three checks before you trust the follow-through
Does the Dow close above 54,744.33? A close, not an intraday print. Until then the 58,302 measured target is a piece of geometry, not a forecast.
Does the 10-year hold below 4.90%? The rotation needed rate relief to work. If yields push back toward the 5.36% October high, the financials that led Nov 4 lose their reason to lead.
Does the equal-weight gap close or snap back? A 99th-percentile divergence is a mean-reversion signal as much as a rotation signal. If the gap narrows by the large-cap side rising rather than the equal-weight side falling, the rotation was a one-day event.
The 1,569 points are real. The rotation is confirmed by banks and the VIX, not by the index level — and the index level is the one thing that has not yet cleared its August ceiling.
Read more
* The content presented above, whether from a third party or not, is considered as general advice only. This article should not be construed as containing investment advice, investment recommendations, an offer of or solicitation for any transactions in financial instruments.


