Gold price extends its decline below $2,500 on the US Dollar recovery

Mitrade
coverImg
Source: DepositPhotos
  • Gold price trades in negative territory for the third consecutive day in Tuesday’s early Asian session. 

  • The rising US Fed rate cut bets and geopolitical risks might help limit Gold’s losses. 

  • Investors await the US August ISM PMI for fresh impetus. 


The Gold price (XAU/USD) loses ground amid the stronger US Dollar (USD) and higher US Treasury bond yields on Tuesday. Nonetheless, the anticipation that the US Federal Reserve (Fed) will cut interest rates in September might underpin the precious metal price as lower interest rates reduce the opportunity cost of holding non-yielding gold. Additionally, the ongoing geopolitical tensions in the Middle East might boost safe-haven assets like Gold. 

Looking ahead, the Institute for Supply Management’s (ISM) Manufacturing Purchasing Managers Index (PMI) will be published on Tuesday. The highlight for this week will be the US Nonfarm Payrolls (NFP) for August, which might determine the pace of the interest rate cut by the Fed and could influence the Gold price in the near term.


Daily Digest Market Movers: Gold price faces selling pressure amid the rebound of USD 


  • Protests broke out across Israel in fresh fury on Monday over the government’s failure to secure a ceasefire-for-hostages deal with Hamas, per CNN. The move is fuelled by the killing in Gaza of six hostages, whose bodies were retrieved by Israeli soldiers this weekend.


  • China's Caixin Manufacturing PMI climbed to 50.4 in August from 49.8 in July, above the market consensus of 50.0.


  • The US ISM Manufacturing PMI for August is expected to improve to 47.5 in August from 46.8 in July, while the Services PMI is estimated to drop to 51.1 in August versus 51.4 prior. 


  • The US economy is expected to see 163K job additions in August. The Unemployment Rate is expected to tick lower to 4.2%.


  • The markets are now pricing in a nearly 69% possibility of 25 basis points (bps) rate cut by the Fed in September, while the chance of a 50 bps reduction are standing at 31%, according to the CME FedWatch tool.  


Technical Analysis: Gold price maintains positive momentum in the longer term


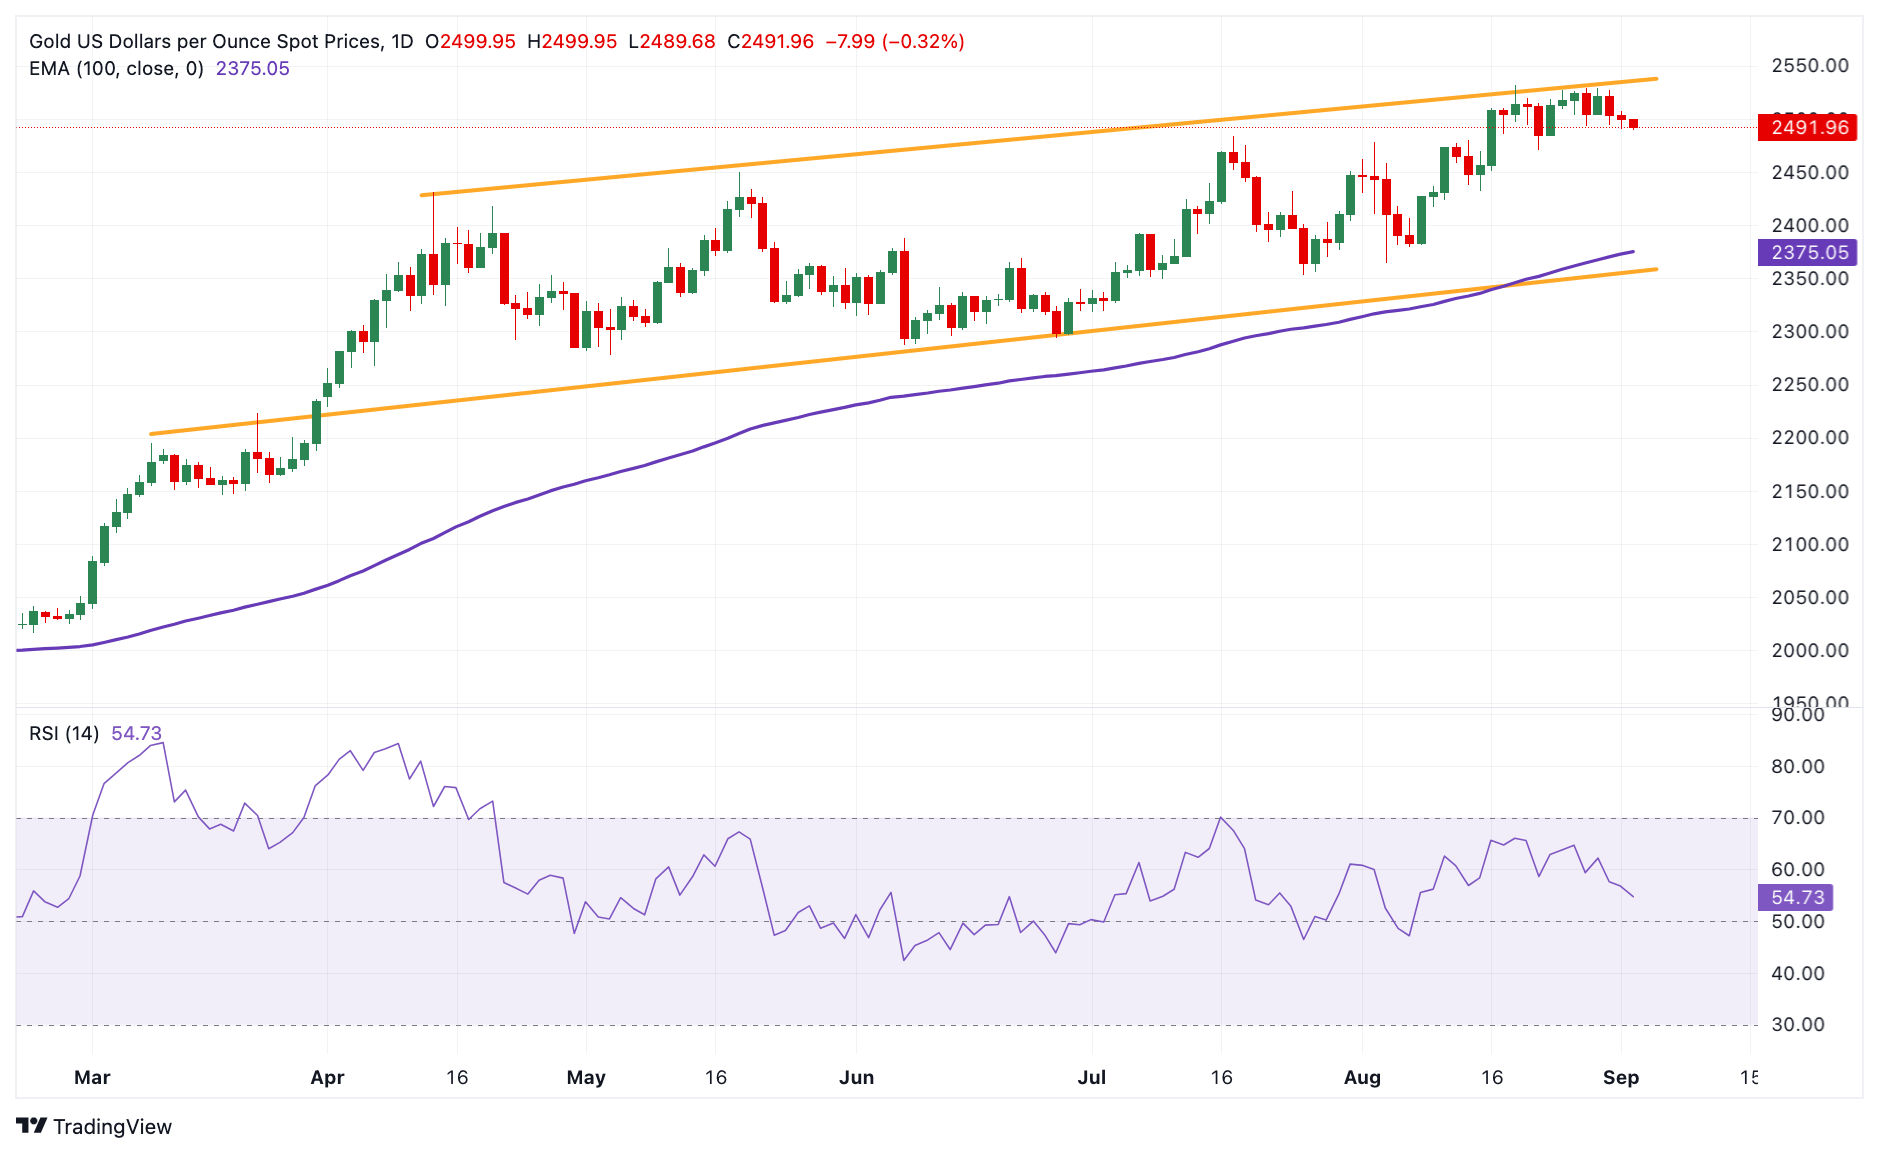
The Gold price drifts lower on the day. According to the daily chart, the constructive outlook of the precious metal prevails as the price is well above the key 100-day Exponential Moving Average (EMA). The upward momentum is reinforced by the 14-day Relative Strength Index (RSI), which stands above the midline around 55.70, suggesting the climb is more likely to resume than to reverse. 

The key resistance level for XAU/USD emerges in the $2,530-$2,540 zone, portraying the five-month-old ascending channel’s upper boundary and the all-time high. A decisive break above the mentioned level could see a rally to the $2,600 psychological level. 

On the flip side, the low of August 22 at $2,470 acts as an initial support level for the yellow metal. A break below this level could drag the price further south to $2,432, the low of August 15. The next contention level to watch is $2,372, the 100-day EMA. 
Read more

  • US October PPI Preview: Fed Rate Hike Expectations Rise, PPI May Be Key Variable; How Will US Stocks, Dollar, and Gold Move?
  • * The content presented above, whether from a third party or not, is considered as general advice only.  This article should not be construed as containing investment advice, investment recommendations, an offer of or solicitation for any transactions in financial instruments.

    goTop
    quote
    Related Articles
    placeholder
    Gold Price Forecast: Gold Tumbles Below $3,900 as Trump Says No Need for Iran Deal; Can October PPI Spur a Rebound? As of the Asian session on Friday (November 13), gold prices (XAUUSD) rebounded intraday following Thursday's sharp decline, trading near $3,910. Previously, gold tumbled 2.76% on Thursda
    Author  TradingKey
    12 hours ago
    As of the Asian session on Friday (November 13), gold prices (XAUUSD) rebounded intraday following Thursday's sharp decline, trading near $3,910. Previously, gold tumbled 2.76% on Thursda
    placeholder
    Gold hit a one-year low while central banks bought 321 tonnes — the sellers were never the ones you thinkSpot gold closed at 3,876 on Thursday, down 2.8% and its lowest close in more than a year, with an intraday low near 3,852. The dollar is at a 19-month high of 103.21 and the 10-year yield is at 5.10%, so the price move is easy to explain. What is harder to explain is who sold: central banks bought 321 tonnes in Q3, the PBoC added for a 24th straight month, ETF holdings are near a record 4,256 tonnes, and roughly 95% of the futures selling came from non-reportable and sovereign-type accounts rather than hedge funds. This piece separates the two books that have to balance.
    Author  Irene Q.
    16 hours ago
    Spot gold closed at 3,876 on Thursday, down 2.8% and its lowest close in more than a year, with an intraday low near 3,852. The dollar is at a 19-month high of 103.21 and the 10-year yield is at 5.10%, so the price move is easy to explain. What is harder to explain is who sold: central banks bought 321 tonnes in Q3, the PBoC added for a 24th straight month, ETF holdings are near a record 4,256 tonnes, and roughly 95% of the futures selling came from non-reportable and sovereign-type accounts rather than hedge funds. This piece separates the two books that have to balance.
    placeholder
    US October PPI Preview: Fed Rate Hike Expectations Rise, PPI May Be Key Variable; How Will US Stocks, Dollar, and Gold Move?On Friday (Nov. 13) Eastern Time, the U.S. will release the October Producer Price Index (PPI). Following the October CPI once again exceeding expectations, the market will look to the PP
    Author  TradingKey
    Yesterday 08: 36
    On Friday (Nov. 13) Eastern Time, the U.S. will release the October Producer Price Index (PPI). Following the October CPI once again exceeding expectations, the market will look to the PP
    placeholder
    Gold closed below $4,000 again — the ETF crowd and central banks stayed, the momentum money leftSpot gold is trading near $3,999, its third consecutive lower daily low, after a 5.00% 10-year yield and a 102.85 dollar index raised the odds of a December hike to 87%. But the selling is not coming from the strategic holders: managed-money net longs fell to 324 tonnes, a 21-week low, and Goldman Sachs attributes roughly 95% of five weeks of selling to non-reportable positions. ETFs still hold a record 4,256 tonnes and central banks bought 321 tonnes in Q3. The table below sets the triggers, directions and levels.
    Author  Irene Q.
    Yesterday 03: 20
    Spot gold is trading near $3,999, its third consecutive lower daily low, after a 5.00% 10-year yield and a 102.85 dollar index raised the odds of a December hike to 87%. But the selling is not coming from the strategic holders: managed-money net longs fell to 324 tonnes, a 21-week low, and Goldman Sachs attributes roughly 95% of five weeks of selling to non-reportable positions. ETFs still hold a record 4,256 tonnes and central banks bought 321 tonnes in Q3. The table below sets the triggers, directions and levels.
    placeholder
    Gold Extends Slide Below $4,000 as Rising US Inflation, Fed December Hike Bets Pressure Prices On November 12, gold prices (XAUUSD) extended their recent losses, falling further below $4,000 in early Asian trading to hit an intraday low near $3,968, marking a third consecutive day
    Author  TradingKey
    Yesterday 02: 00
    On November 12, gold prices (XAUUSD) extended their recent losses, falling further below $4,000 in early Asian trading to hit an intraday low near $3,968, marking a third consecutive day
    Live Quotes
    Name / SymbolChart% Change / Price
    XAUUSD
    XAUUSD
    0.00%0.00
    USDOLLAR-F
    USDOLLAR-F
    0.00%0.00

    Gold Related Articles

    • 10 Best Day Trading Platforms for Beginners and Active Traders in 2026: A Practical Guide
    • What is Gold CFD? How to Trade Gold CFD With Mitrade Example
    • ​5 Best Paper Trading Platforms for 2026 (Free Demo Accounts for Beginners & Traders)
    • XAU/USD Gold Price Trend Analysis 2026: Will It Keep Rising?
    • Is Mitrade Right for You? A Complete Guide on How to Start Trading CFDs in 5 Steps
    • How and Where to Buy Gold in Australia? A Complete Guide for Beginners

    Click to view more