

Gold Rallies for Third Straight Day. Trump Says US-Iran Deal Will Be Reached, Can Gold Prices Return Above $4,500?

- Iranian military drones targeted US Fifth Fleet in Bahrain in response to southern US strikes
- Gold Price Trend Forecast: US-Iran Peace Talks Drive Gold Rebound, Is the Gold Slump Over?
- Gold plummets below $4,200 as US‑Iran tensions spur hawkish rate bets ahead of US CPI
- SpaceX Listing Imminent. Funds Flood Into SpaceX On-Chain Tokens, Bitcoin Rebound Momentum May Be Weakened
- US May CPI Preview: Rising Inflation May Push Up Fed Rate Hike Expectations, How Will US Stocks, Dollar, Gold React?
- Gold Drops Below $4,300 Erasing Year-to-Date Gains. This Week’s CPI May Ignite Rate Hike Expectations Will Gold Still Rise in 2026?
TradingKey - As of the Asian session today (June 15), driven by significant progress in US-Iran negotiations, gold prices today ( XAUUSD) gapped higher at the open, with intraday gains exceeding 2%; meanwhile, gold prices have rallied for three consecutive trading sessions, gaining more than $300. However, it should be noted that gold faces resistance at $4,360, and short-term upside potential may be limited.
US-Iran negotiations have made significant progress, but this does not indicate that the conflict has ended.
From a fundamental perspective, the most significant factor affecting gold price movements today is the major progress in U.S.-Iran negotiations.
Latest reports indicate that U.S. President Trump stated both sides have reached an agreement to end the conflict, with a formal signing expected on June 19 in Switzerland. Trump also emphasized that as the deal advances, the Strait of Hormuz will reopen and the U.S. will lift blockades on Iranian ports.
Meanwhile, Iran's Deputy Foreign Minister Gharibabadi confirmed that the text of the Iran-U.S. memorandum of understanding has been finalized, with the formal signing ceremony set for June 19 in Switzerland. Iranian officials also projected a relatively firm yet cooperative stance, asserting that their commitments are limited while their gains are substantial. This suggests Iran is not making unilateral concessions but seeks to trade the agreement for the lifting of port blockades, easing of oil exports, asset releases, and leverage in future sanctions talks.
Following the news, the crude oil market plummeted. At today's open, WTI crude ( USOIL) and Brent crude both gapped lower and continued to decline. As of press time, WTI crude briefly fell below the $80 mark intraday, dropping more than 5% to $79.70, while Brent crude fell over 4% to $82.74.
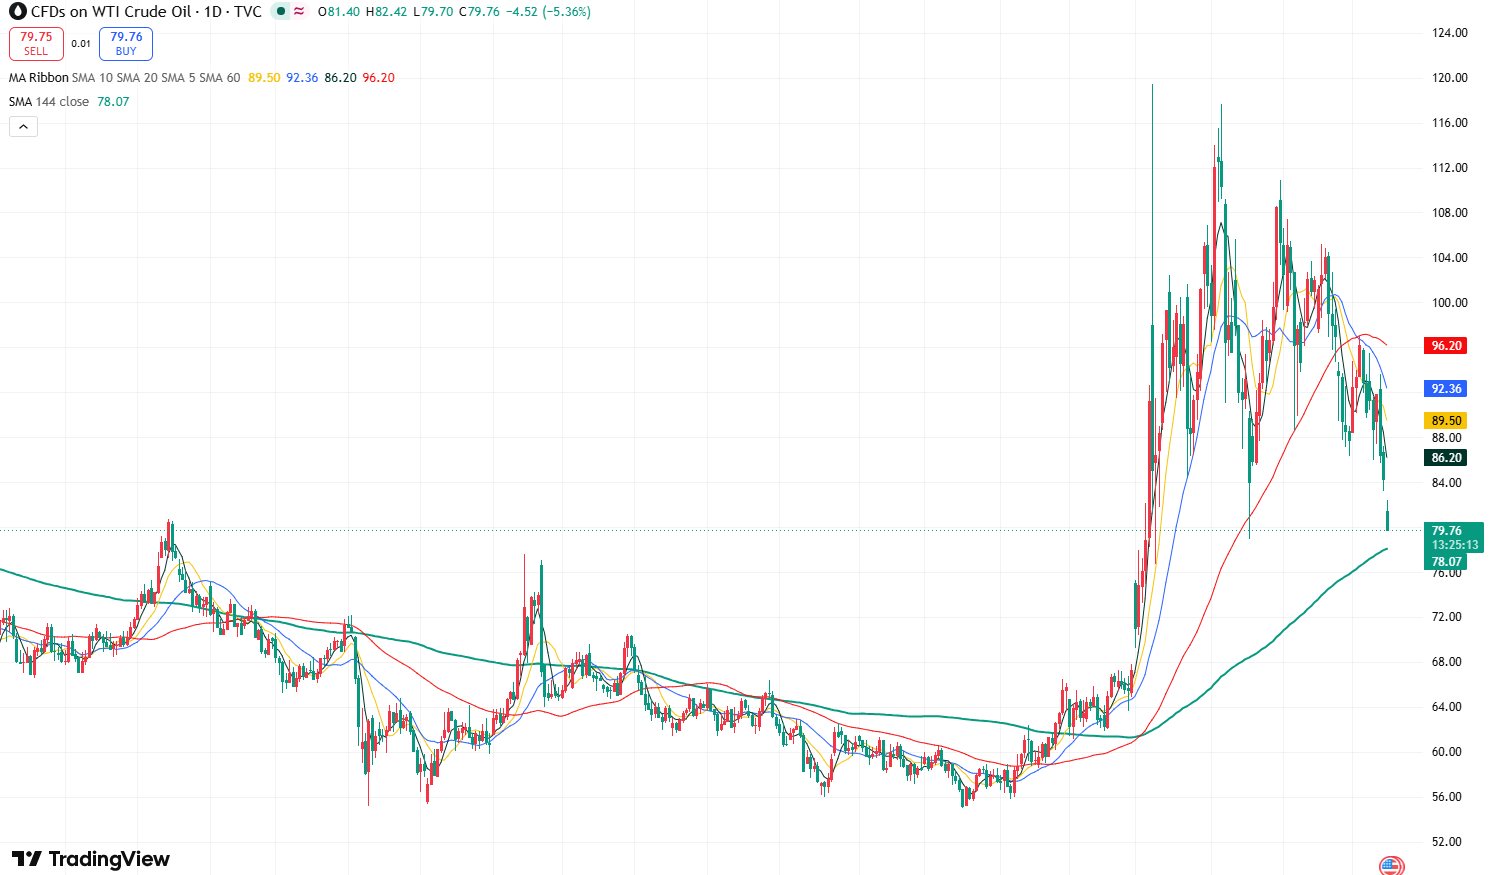
WTI Crude Oil Price Daily Chart, Source: TradingView
However, it should be noted that the U.S.-Iran situation is not completely resolved. First, the agreement is still in the pre-signing phase, and the market awaits confirmation of its implementation on June 19. Second, the reopening of the Strait of Hormuz does not equate to an immediate full recovery of oil shipments; mine clearing, maritime safety, insurance costs, and the willingness of shipping companies all require time. Third, the Iranian nuclear issue remains unresolved, and negotiations over the next 60 days may see setbacks. Fourth, variables involving Israel, Lebanon, and Hezbollah could still disrupt the agreement's execution.
Gold Price Trend Analysis: $4,360 Becomes Key Resistance Level for Bulls
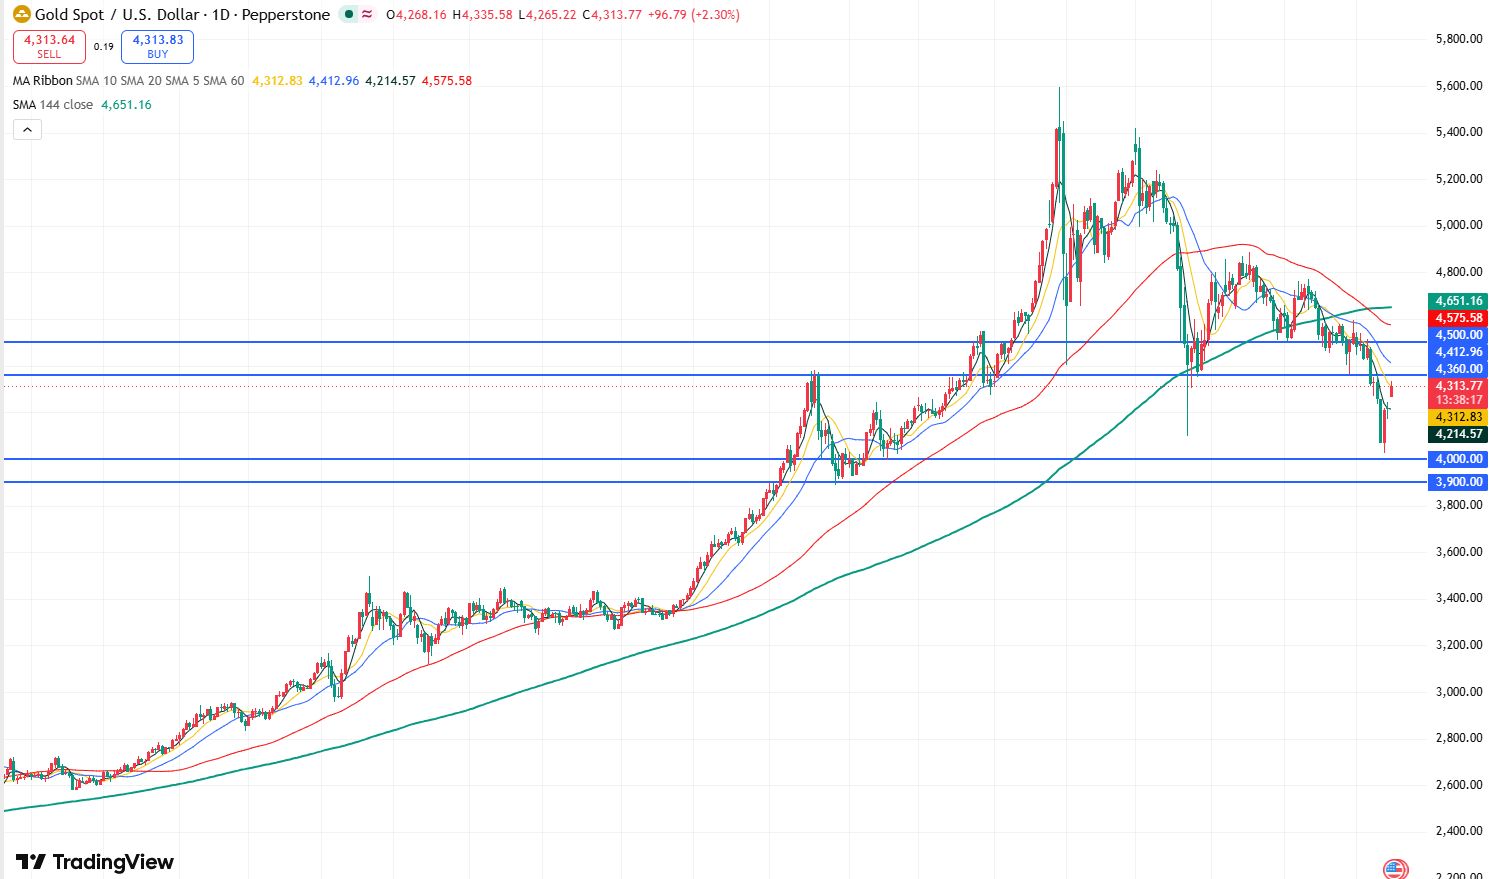
Gold Price Daily Chart, Source: TradingView
Based on the daily chart, gold prices found support near the key $4,000 level last week and have since rebounded for three consecutive sessions. Today, bolstered by significant progress in U.S.-Iran negotiations, gold reached an intraday high of $4,335.58, nearing critical resistance at $4,360. As this level aligns with the 20-day moving average, it may create a confluence of resistance, potentially dampening short-term upward momentum.
Presently, if gold closes below the $4,360 resistance today while remaining capped by the 20-day moving average, the short-term rebound could conclude, resuming the prior downtrend to retest the $4,000 support.
On the upside, gold must first break and sustain its position above the key $4,360 resistance level to unlock further gains, with the potential to test the $4,500 resistance level.
Read more
* The content presented above, whether from a third party or not, is considered as general advice only. This article should not be construed as containing investment advice, investment recommendations, an offer of or solicitation for any transactions in financial instruments.


