

Dow Jones Industrial Average digs in heels and trades flat despite Retail Sales miss
- Dow Jones holding onto familiar levels with US markets set for mid-week break.
- US Retail Sales missed the mark on Tuesday, raising economic activity concerns.
- Investors are putting in double-duty trying to brush off Fed caution.
The Dow Jones Industrial Average (DJIA) is treading water on Tuesday as investors buckle down for the mid-week Juneteenth holiday. US Retail Sales missed the mark in May, and Federal Reserve (Fed) officials have been working double duty on Tuesday to try and tamp down broad-market expectations for an upcoming rate cut that may not materialize as policymakers await further signs of easing inflation.
US Retail Sales grew by a scant 0.1% MoM in May, missing the forecast 0.2%. The previous month’s print was also revised down to -0.2% from 0.0%. Core Retail Sales, or Retail Sales excluding automobiles, declined 0.1% and missing the forecast growth of 0.2%, with the previous release also getting revised to -0.1% from 0.2%.
Federal Reserve officials lean into cautious stance as policymakers wait for further signs of easing
A flurry of Fed official appearances on Tuesday hammered home the Fed’s desire to wait until more inflation data is collected before making any decisions on policy rates. Fed heads from multiple Federal Reserve banks noted that despite a sharp downturn in inflation in recent data, stubborn inflation prints from the first quarter of 2024 continue to spook rate discussions, and policymakers noted the relative strength of the US economy and a still-tight labor market as reasons there is no rush to deliver rate cuts at a pace that markets continue to hope for.
At current cut, the CME’s FedWatch Tool still shows that rate markets are pricing in nearly 70% odds of at least a quarter-point rate trim from the Fed in September.
Dow Jones news
The Dow Jones is roughly balanced on Tuesday, with roughly half of the index’s constituent securities in the green for the day. Losses are being led by Boeing Co. (BA), which declined nearly 2% to $174.94 per share. Goldman Sachs Group Inc. (GS) climbed 1.5% to $456.96 per share, closely followed by Verizon Communications Inc. (VZ), which gained 1.4% to cross above $40.00 per share.
Dow Jones technical outlook
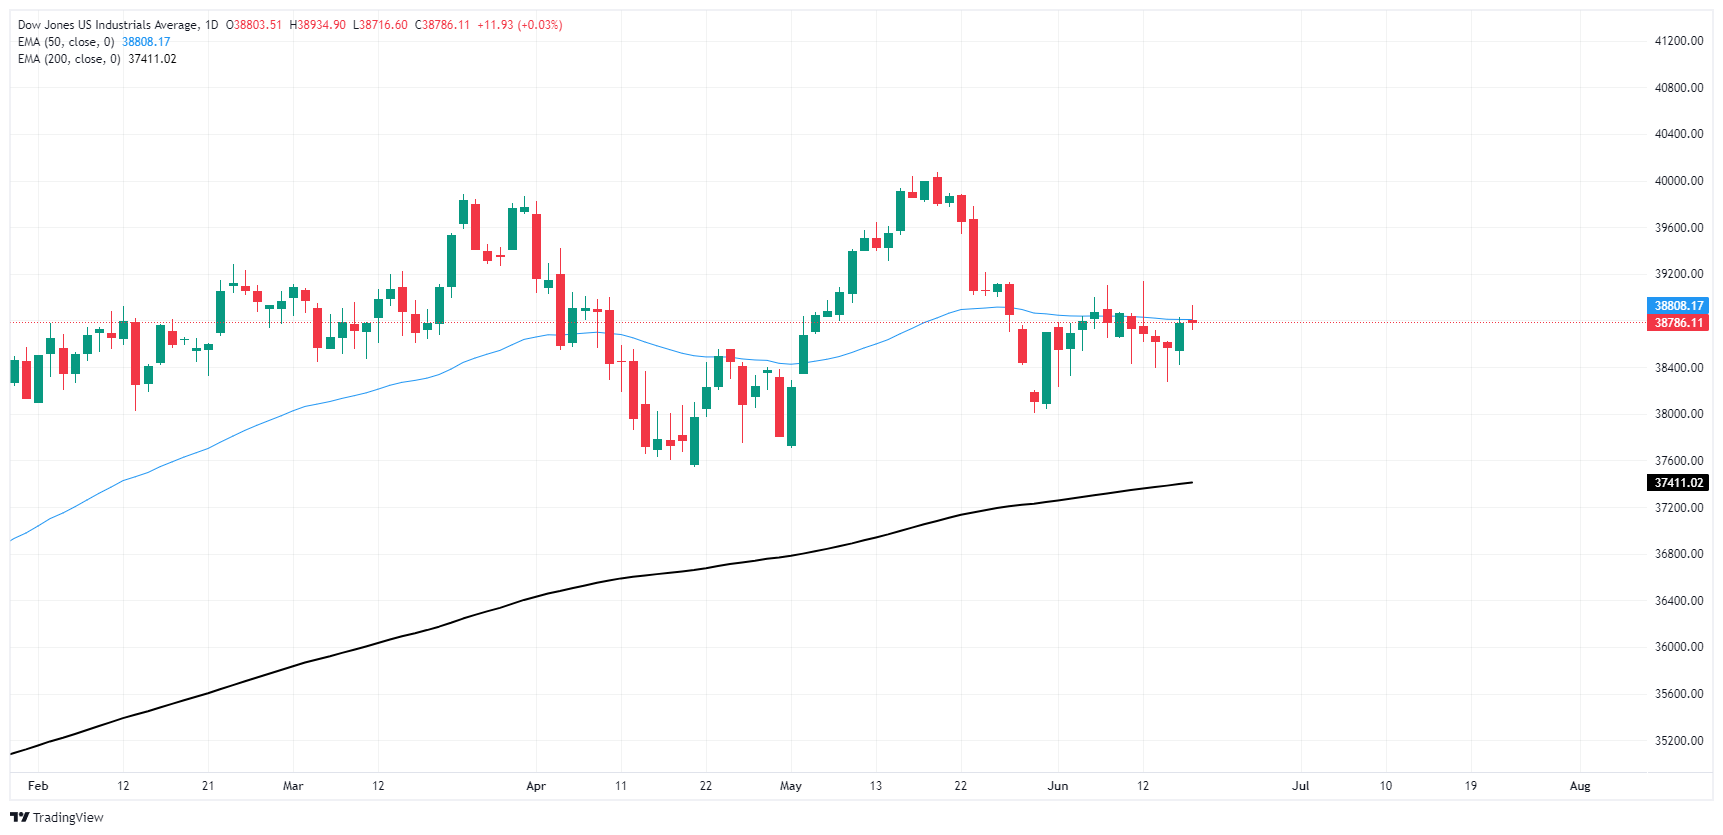
The Dow Jones is hamstrung in the middle on Tuesday, cycling chart territory around 38,800.00 as markets struggle to find a reason to push too far in either direction. The DJIA is trading into technical congestion at the 50-day Exponential Moving Average (EMA) at 38,808.33, and daily candlesticks are swamped out in the middle despite holding tightly to bullish chart levels above the 200-day EMA at 37,411.02.
Dow Jones five minute chart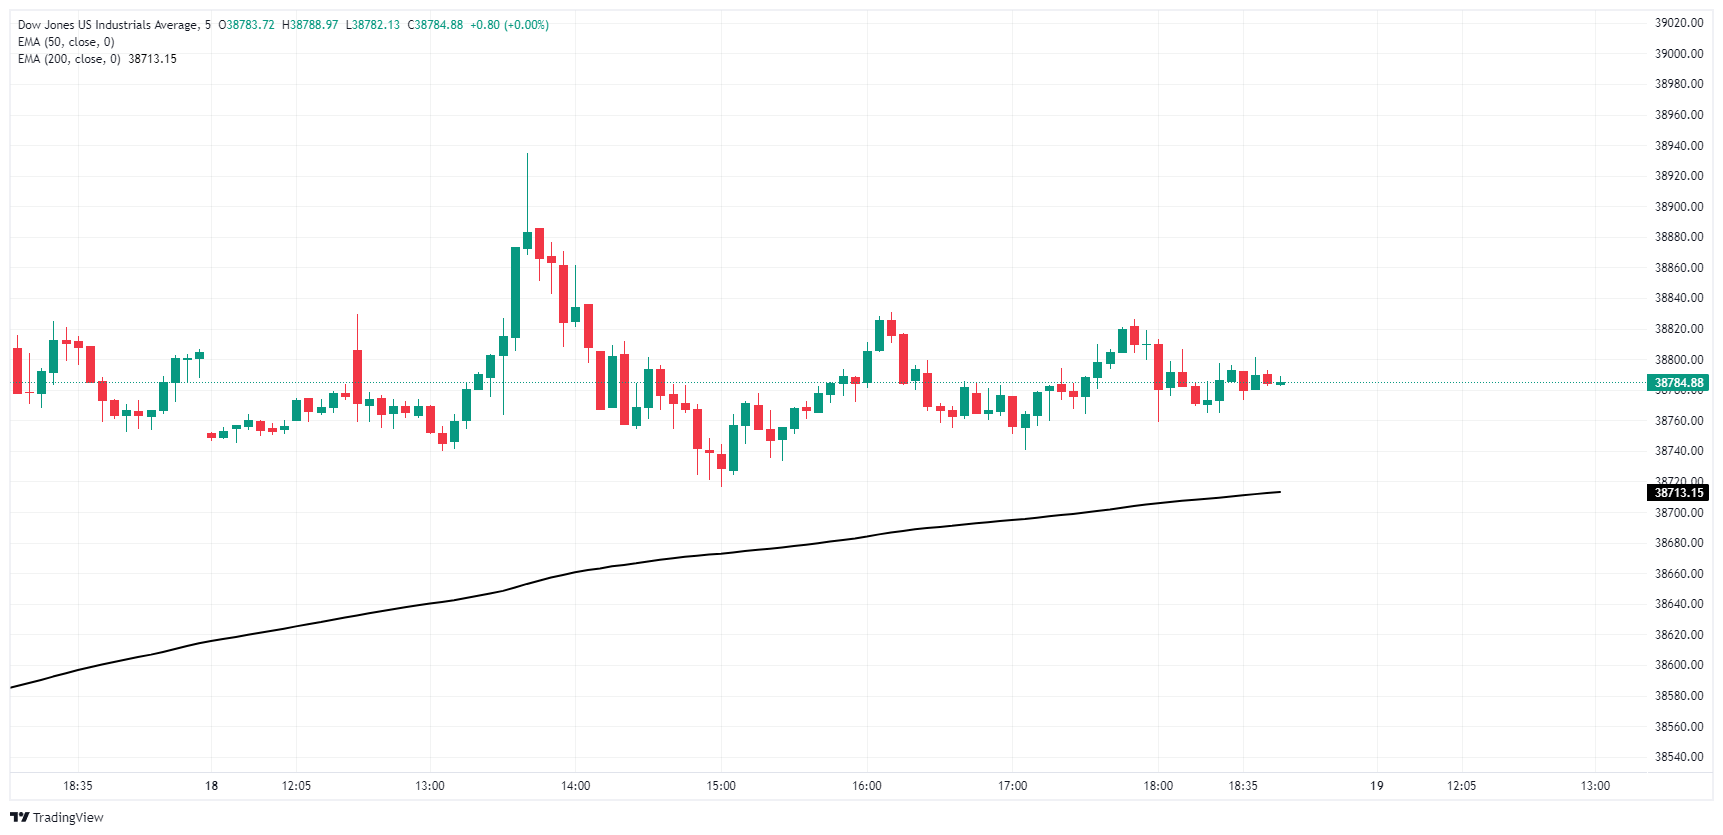
Dow Jones daily chart
Dow Jones FAQs
The Dow Jones Industrial Average, one of the oldest stock market indices in the world, is compiled of the 30 most traded stocks in the US. The index is price-weighted rather than weighted by capitalization. It is calculated by summing the prices of the constituent stocks and dividing them by a factor, currently 0.152. The index was founded by Charles Dow, who also founded the Wall Street Journal. In later years it has been criticized for not being broadly representative enough because it only tracks 30 conglomerates, unlike broader indices such as the S&P 500.
Many different factors drive the Dow Jones Industrial Average (DJIA). The aggregate performance of the component companies revealed in quarterly company earnings reports is the main one. US and global macroeconomic data also contributes as it impacts on investor sentiment. The level of interest rates, set by the Federal Reserve (Fed), also influences the DJIA as it affects the cost of credit, on which many corporations are heavily reliant. Therefore, inflation can be a major driver as well as other metrics which impact the Fed decisions.
Dow Theory is a method for identifying the primary trend of the stock market developed by Charles Dow. A key step is to compare the direction of the Dow Jones Industrial Average (DJIA) and the Dow Jones Transportation Average (DJTA) and only follow trends where both are moving in the same direction. Volume is a confirmatory criteria. The theory uses elements of peak and trough analysis. Dow’s theory posits three trend phases: accumulation, when smart money starts buying or selling; public participation, when the wider public joins in; and distribution, when the smart money exits.
There are a number of ways to trade the DJIA. One is to use ETFs which allow investors to trade the DJIA as a single security, rather than having to buy shares in all 30 constituent companies. A leading example is the SPDR Dow Jones Industrial Average ETF (DIA). DJIA futures contracts enable traders to speculate on the future value of the index and Options provide the right, but not the obligation, to buy or sell the index at a predetermined price in the future. Mutual funds enable investors to buy a share of a diversified portfolio of DJIA stocks thus providing exposure to the overall index.
Empfohlene Artikel


