AUD/JPY Price Analysis: Yen performance fuels continued uptrend, pair stretches above 108.00
- AUD/JPY strengthens its position, touching new peaks beyond 108.00.
- Overbought conditions could trigger a healthy correction, yet the outlook reveals a continuation of momentum.
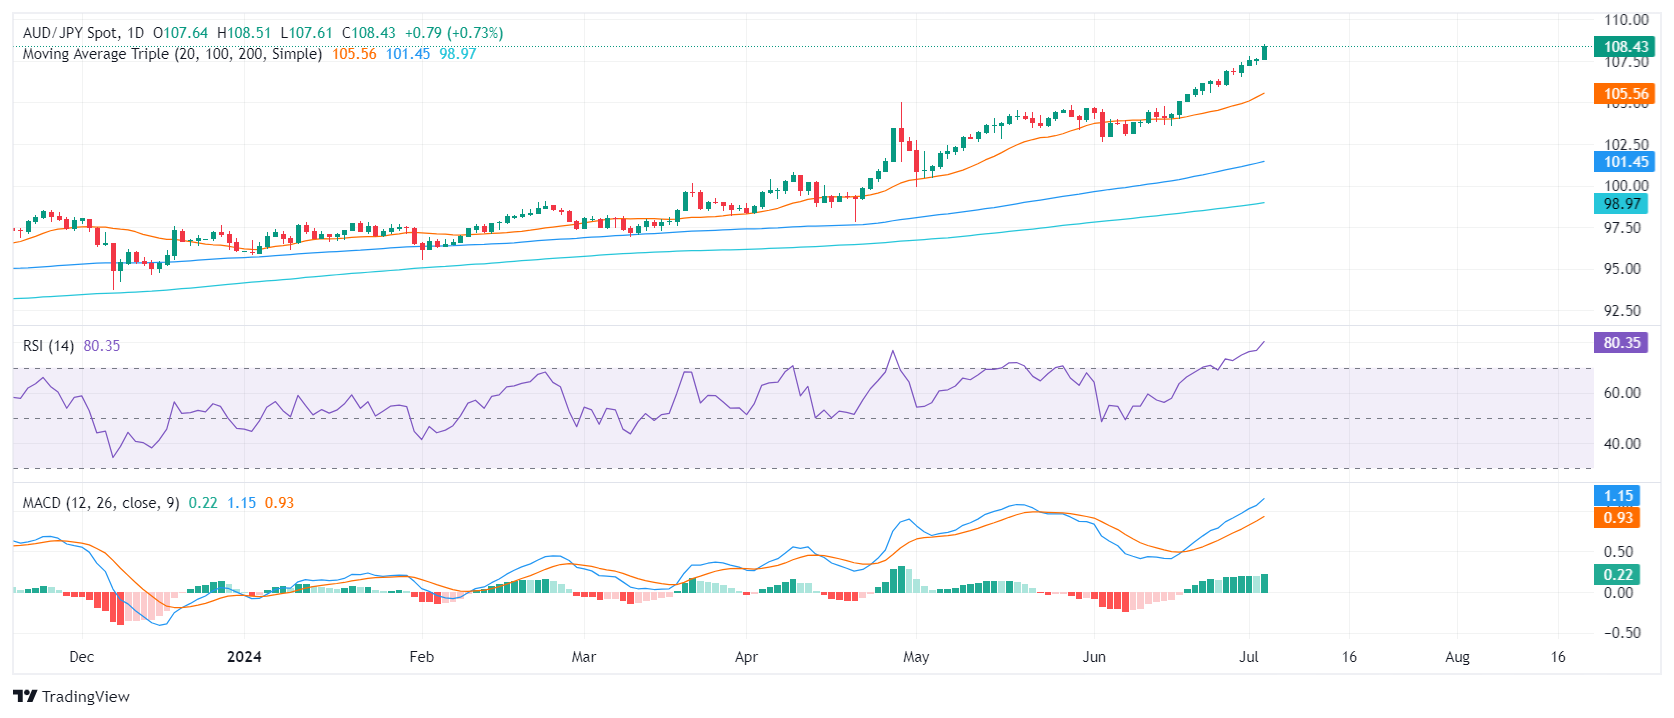
In Wednesday's session, the AUD/JPY pair elongated its upward trajectory, reaching new high points around 108.40, hence beating its record once again after crossing its 2007 highs of around 107.30.
On a daily scale, the Relative Strength Index (RSI) for the AUDJPY settled at 80 and it concurrently flags the pair as overbought, which may provoke a downward correction. Parallely, the Moving Average Convergence Divergence (MACD) depicts growing green bars, signifying stubborn bullish momentum, although a correction seems likely given the overbought situation.
AUD/JPY daily chart

In the broader perspective, the AUD/JPY pair exhibits relentless bullish behaviors, fortified by its standing above the 20-day, 100-day, and 200-day Simple Moving Averages (SMAs). Should the pair face a correction pulling it beneath the 108.00 level, followed by the 107.00 mark, it could discover new support levels. Thus, the 104.90 (20-day SMA) level may act as another potential support line. Meanwhile, buyers will investigate unexplored grounds should the pair stay on its current course and surpass the 108.50 level.


