Canadian Dollar gives mixed performance on holiday-thinned Wednesday

Quelle Fxstreet
  • Canadian Dollar trades tightly during the mid-week market session.
  • Canada relegated to strictly mid-tier data releases for the rest of the week.
  • BoC Summary of Deliberations is unlikely to deliver anything new.

The Canadian Dollar (CAD) is treading water on Wednesday, trading within a scant tenth of a percent against its largest peer — the US Dollar (USD). US markets are shuttered for the midweek Juneteenth holiday, thinning out market volumes as investors look ahead to key data prints on Friday.

Canada has only mid-tier data releases on the docket for the remainder of the trading week. CAD traders will watch Wednesday’s latest Summary of Deliberations from the Bank of Canada (BoC), but no major revelations are expected. With US markets shuttered for the holiday, trading volumes are thin and investors will be returning to the fold in force to hunker down and wait for Friday’s US Purchasing Managers Index (PMI) print.

Daily digest market movers: Canadian Dollar treads water on quiet Wednesday

  • The Canadian Dollar has been on a slow grind this week, finding thin gains against the Greenback. From the week's opening bids, the CAD is up a scant fifth of a percent against the USD.
  • The BoC’s Summary of Deliberations, slated for release midway through the US Wednesday session, is not expected to bring any new details to the BoC’s policy stance.
  • Risk appetite is stubbornly holding on balance as investors brush off a wave of cautious talking points from Federal Reserve (Fed) officials this week. Policymakers still want to see more signs of cooling inflation in the US before committing to even discussing rate cuts.
  • Interest rate markets are still staunchly committed to hopes for a September rate cut. According to the CME’s FedWatch tool, rate traders are pricing in nearly 70% odds of at least a quarter-point rate trim from the Federal Open Market Committee (FOMC) at the September 18 meeting.
  • Before Friday’s US PMI print, Thursday will deliver a week-on-week update to US Initial Jobless Claims, a popular bellwether for near-term economic performance.

Canadian Dollar PRICE Today

The table below shows the percentage change of Canadian Dollar (CAD) against listed major currencies today. Canadian Dollar was the strongest against the New Zealand Dollar.

  USD EUR GBP JPY CAD AUD NZD CHF
USD   -0.07% -0.09% 0.06% -0.04% -0.23% 0.20% -0.01%
EUR 0.07%   -0.03% 0.14% 0.02% -0.15% 0.28% 0.06%
GBP 0.09% 0.03%   0.16% 0.05% -0.13% 0.31% 0.10%
JPY -0.06% -0.14% -0.16%   -0.10% -0.28% 0.15% -0.05%
CAD 0.04% -0.02% -0.05% 0.10%   -0.18% 0.25% 0.05%
AUD 0.23% 0.15% 0.13% 0.28% 0.18%   0.44% 0.24%
NZD -0.20% -0.28% -0.31% -0.15% -0.25% -0.44%   -0.21%
CHF 0.01% -0.06% -0.10% 0.05% -0.05% -0.24% 0.21%  

The heat map shows percentage changes of major currencies against each other. The base currency is picked from the left column, while the quote currency is picked from the top row. For example, if you pick the Canadian Dollar from the left column and move along the horizontal line to the US Dollar, the percentage change displayed in the box will represent CAD (base)/USD (quote).

Technical analysis: Canadian Dollar churns in place on Wednesday, USD/CAD finds a floor at 1.3700

The Canadian Dollar (CAD) is trading thin on Wednesday, holding close to flat against the Greenback and stuck within a fifth of a percent across the major currency board. USD/CAD eased back to the 1.3700 handle before finding a floor in the midweek markets session, but the pair is trading into the low side of median bids at the 200-hour Exponential Moving Average (EMA) near 1.3725.

Despite a lack of near-term momentum, the CAD is slowly grinding out thin gains against the US Dollar. The USD/CAD has closed flat or down for all but one of the last seven straight trading days, and Wednesday is firmly on pace to chalk in an eighth. The pair is still holding on the high side of the 50-day EMA at 1.3675 and remains trapped in bull country above the 200-day EMA at 1.3578.

USD/CAD hourly chart
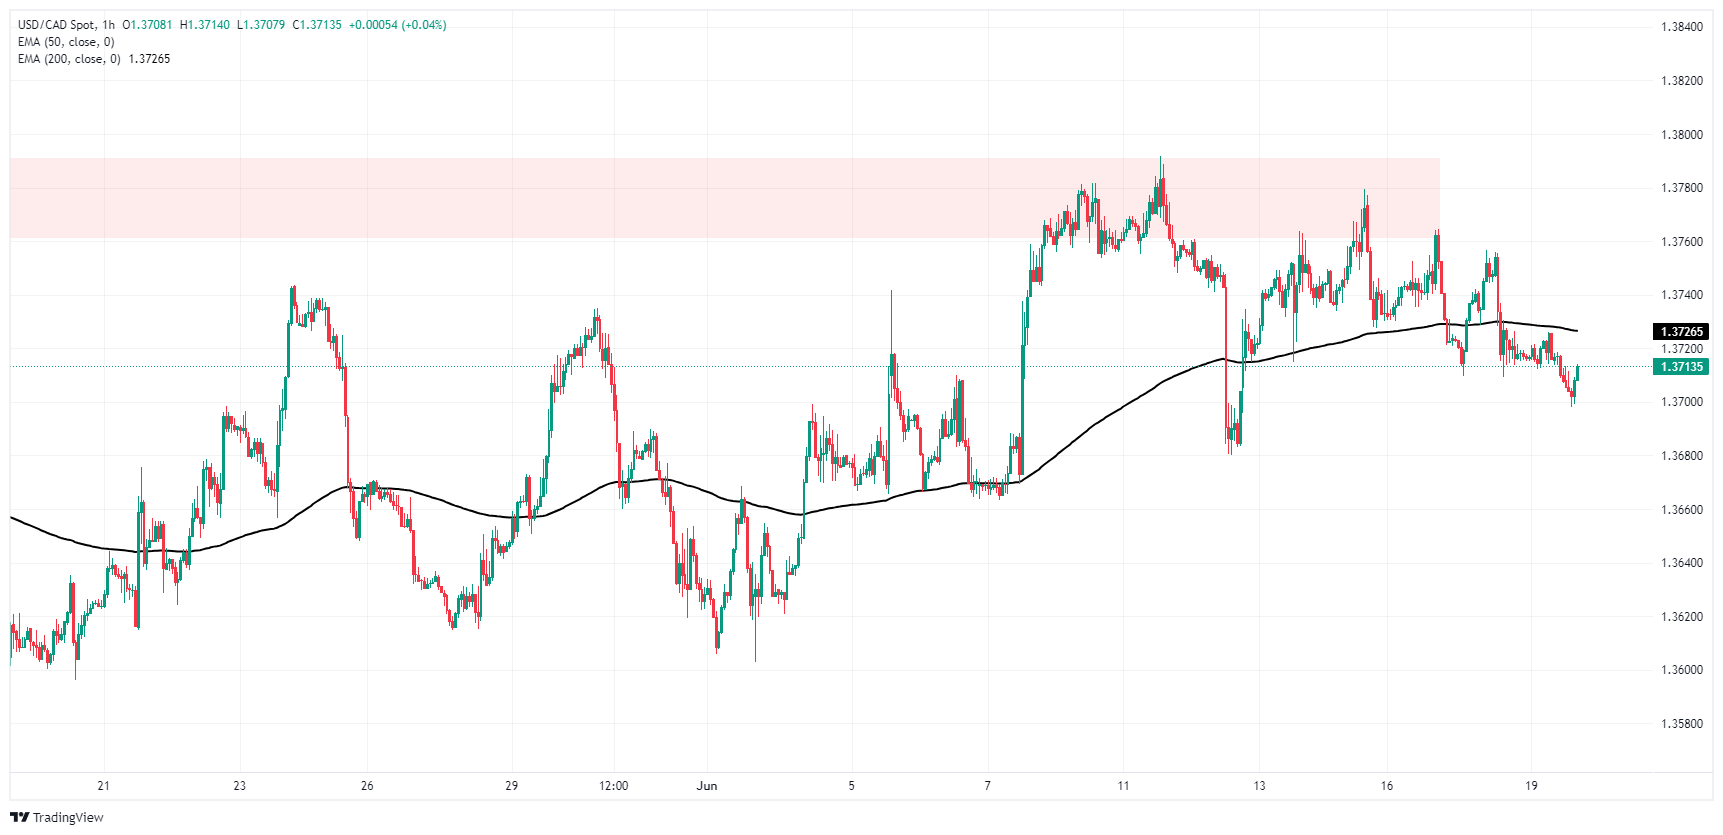
USD/CAD daily chart

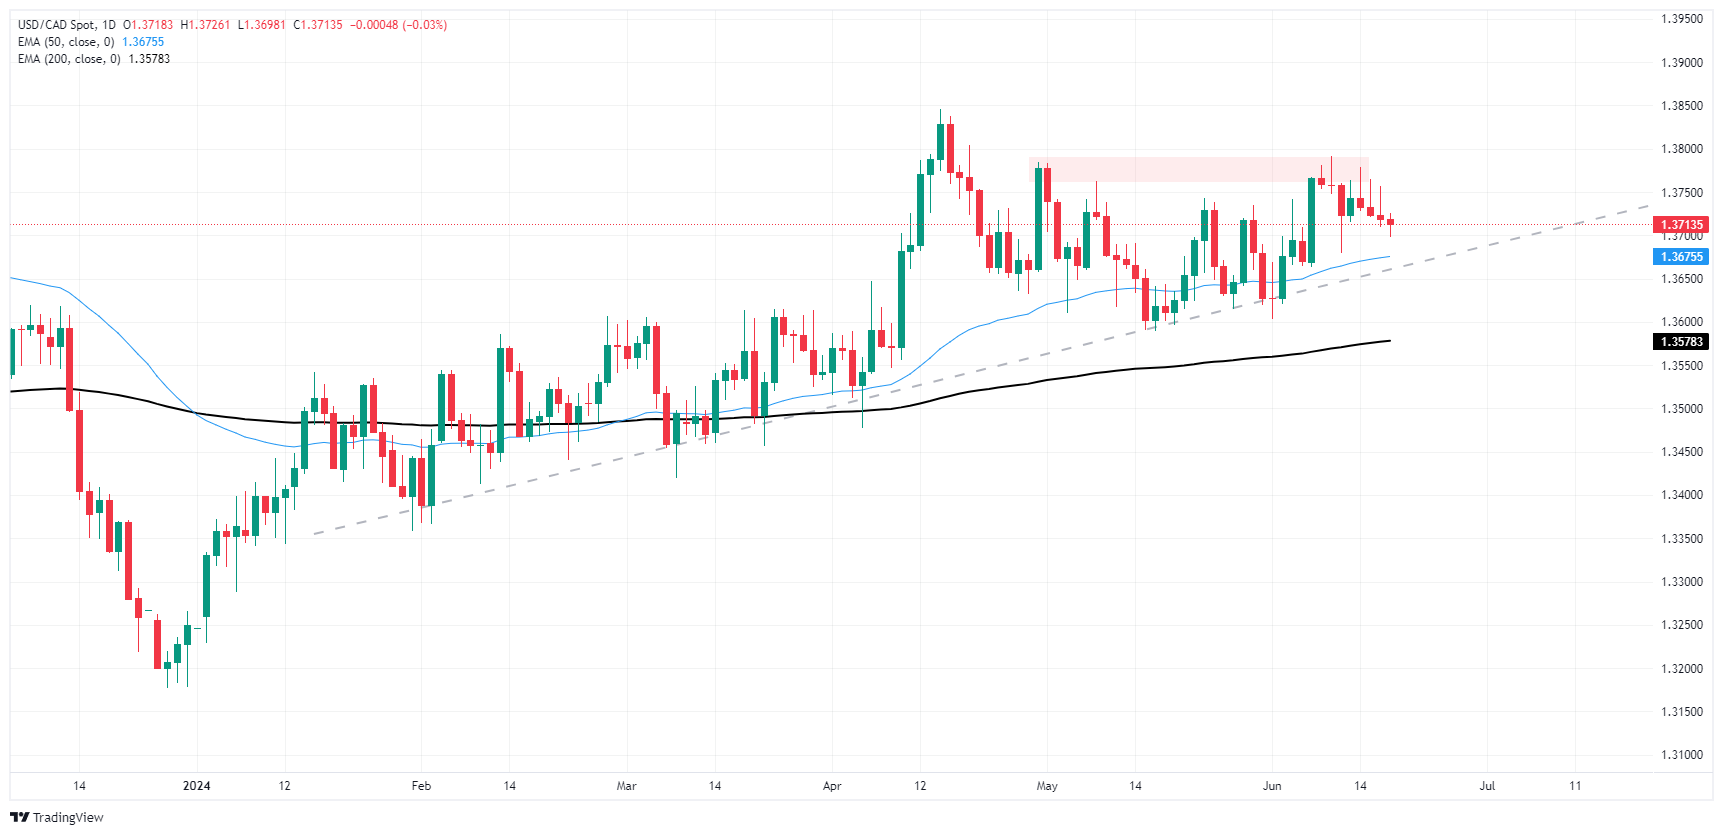
Canadian Dollar FAQs

The key factors driving the Canadian Dollar (CAD) are the level of interest rates set by the Bank of Canada (BoC), the price of Oil, Canada’s largest export, the health of its economy, inflation and the Trade Balance, which is the difference between the value of Canada’s exports versus its imports. Other factors include market sentiment – whether investors are taking on more risky assets (risk-on) or seeking safe-havens (risk-off) – with risk-on being CAD-positive. As its largest trading partner, the health of the US economy is also a key factor influencing the Canadian Dollar.

The Bank of Canada (BoC) has a significant influence on the Canadian Dollar by setting the level of interest rates that banks can lend to one another. This influences the level of interest rates for everyone. The main goal of the BoC is to maintain inflation at 1-3% by adjusting interest rates up or down. Relatively higher interest rates tend to be positive for the CAD. The Bank of Canada can also use quantitative easing and tightening to influence credit conditions, with the former CAD-negative and the latter CAD-positive.

The price of Oil is a key factor impacting the value of the Canadian Dollar. Petroleum is Canada’s biggest export, so Oil price tends to have an immediate impact on the CAD value. Generally, if Oil price rises CAD also goes up, as aggregate demand for the currency increases. The opposite is the case if the price of Oil falls. Higher Oil prices also tend to result in a greater likelihood of a positive Trade Balance, which is also supportive of the CAD.

While inflation had always traditionally been thought of as a negative factor for a currency since it lowers the value of money, the opposite has actually been the case in modern times with the relaxation of cross-border capital controls. Higher inflation tends to lead central banks to put up interest rates which attracts more capital inflows from global investors seeking a lucrative place to keep their money. This increases demand for the local currency, which in Canada’s case is the Canadian Dollar.

Macroeconomic data releases gauge the health of the economy and can have an impact on the Canadian Dollar. Indicators such as GDP, Manufacturing and Services PMIs, employment, and consumer sentiment surveys can all influence the direction of the CAD. A strong economy is good for the Canadian Dollar. Not only does it attract more foreign investment but it may encourage the Bank of Canada to put up interest rates, leading to a stronger currency. If economic data is weak, however, the CAD is likely to fall.


Haftungsausschluss: Nur zu Informationszwecken. Die bisherige Performance ist kein verlässlicher Indikator für zukünftige Ergebnisse.
placeholder
Silberpreis heute: Silber steigt laut FXStreet-DatenDie Preise für Silber (XAG/USD) stiegen am Montag, wie aus FXStreet-Daten hervorgeht. Der Silberpreis liegt bei 109,94 USD pro Unze, was einem Anstieg von 7,28 % gegenüber den 102,48 USD vom Freitag entspricht
Autor  FXStreet
Mo. 26.Jan
Die Preise für Silber (XAG/USD) stiegen am Montag, wie aus FXStreet-Daten hervorgeht. Der Silberpreis liegt bei 109,94 USD pro Unze, was einem Anstieg von 7,28 % gegenüber den 102,48 USD vom Freitag entspricht
placeholder
Silber steigt in Asien auf 113,50 US-Dollar – Safe-Haven-Nachfrage und Fed im FokusSilber (XAG/USD) steigt am Mittwoch in Asien auf 113,50 US-Dollar (+1,30%), gestützt von Dollar-Schwäche, Safe-Haven-Nachfrage und Zinssenkungsfantasie, während die Fed-Entscheidung und mögliche Gewinnmitnahmen nach über 200% Jahresplus im Fokus stehen.
Autor  Mitrade Team
Mi. 28.Jan
Silber (XAG/USD) steigt am Mittwoch in Asien auf 113,50 US-Dollar (+1,30%), gestützt von Dollar-Schwäche, Safe-Haven-Nachfrage und Zinssenkungsfantasie, während die Fed-Entscheidung und mögliche Gewinnmitnahmen nach über 200% Jahresplus im Fokus stehen.
placeholder
Krypto-Ausblick: Bitcoin stabilisiert sich über 87.787 US-Dollar – Ether vor der nächsten Hürde, XRP bleibt fragil• Bitcoin pendelt am Mittwoch um 89.000 US-Dollar und hat sich nach der Vorwochenkorrektur bislang um knapp 3% erholt – entscheidend bleibt die Zone um 87.787 US-Dollar. • Ethereum arbeitet sich an die Widerstandszone heran: Erst ein Tagesschluss über 3.017 US-Dollar und der 50-Tage-EMA bei 3.101 US-Dollar würde den Weg nach oben freimachen. • XRP prallt von 1,83 US-Dollar ab und steht wieder bei 1,90 US-Dollar – doch RSI und MACD sprechen weiter für Vorsicht. Nach der kräftigen Korrektur der vergangenen Woche setzt sich im Kryptomarkt eine vorsichtige Stabilisierung durch. Bitcoin, Ether und XRP bauen ihre Erholung aus, stoßen nun aber auf charttechnisch wichtige Marken, an denen sich entscheidet, ob aus der Gegenbewegung mehr wird – oder ob der nächste Rücksetzer folgt. Bitcoin: 87.787 US-Dollar bleibt der Dreh- und Angelpunkt Bitcoin hat am Montag nach der 7,48%-Korrektur der Vorwoche wieder oberhalb der Mittellinie eines horizontalen Parallelkanals bei 87.787 US-Dollar geschlossen. Am Dienstag verteidigte der Kurs diese Zone erneut, am Mittwoch notiert BTC bei rund 89.300 US-Dollar. Hält 87.787 US-Dollar als Support, rückt die obere Begrenzung des Musters bei 90.000 US-Dollar in den Fokus. Der RSI (Tag) liegt bei 45 und steigt in Richtung der neutralen 50 – ein Hinweis auf nachlassenden Verkaufsdruck. Auch der MACD entspannt sich: Die Linien nähern sich an, die roten Histogrammbalken unterhalb der Nulllinie werden schwächer. Bricht Bitcoin dagegen per Tagesschluss wieder unter 87.787 US-Dollar, bleibt die Unterseite anfällig – dann würde die nächste Auffangzone bei 85.569 US-Dollar (zugleich 78,6% Fibonacci-Retracement) wieder relevant. Ethereum: Erst über 3.017 und 3.101 US-Dollar wird es konstruktiver Ethereum startete positiv in die Woche und legte bis Dienstag um 7,62% zu – nach der 14,22%-Korrektur in der Woche davor. Am Mittwoch nähert sich ETH dem zentralen Widerstand bei 3.017 US-Dollar. Für ein klareres Erholungssignal braucht es mehr als nur Intraday-Stärke: Ein Ausbruch über 3.017 US-Dollar und ein Tagesschluss über dem 50-Tage-EMA bei 3.101 US-Dollar könnten den Blick in Richtung des Hochs vom 14. Januar bei 3.402 US-Dollar lenken. Die Momentum-Indikatoren (RSI und MACD) deuten zwar auf nachlassenden Abwärtsdruck hin, aber das Setup bleibt empfindlich. Kommt es stattdessen zu einer erneuten Abweisung an der Widerstandszone, rückt auf der Unterseite das 61,8% Fibonacci-Retracement bei 2.749 US-Dollar wieder ins Blickfeld. XRP: Rebound ja – Trendwende noch nicht XRP hat am Sonntag die tägliche Unterstützung bei 1,83 US-Dollar getestet und anschließend binnen zwei Tagen um 4,51% zugelegt. Am Mittwoch handelt der Kurs bei 1,90 US-Dollar. Solange 1,83 US-Dollar hält, kann sich die Erholung in Richtung des nächsten Widerstands bei 1,96 US-Dollar fortsetzen. Allerdings ist der Unterton noch nicht gedreht: Der RSI liegt bei 42 und damit weiter unter der neutralen 50. Zudem bleibt das Bild im MACD belastet – das bärische Crossover der Vorwoche ist weiterhin aktiv, was das Rückschlagrisiko erhöht. Fällt XRP per Tagesschluss erneut unter 1,83 US-Dollar, wäre ein weiterer Abwärtsimpuls bis zum Tief vom 19. Dezember bei 1,77 US-Dollar wieder ein realistisches Szenario.
Autor  Mitrade Team
Mi. 28.Jan
• Bitcoin pendelt am Mittwoch um 89.000 US-Dollar und hat sich nach der Vorwochenkorrektur bislang um knapp 3% erholt – entscheidend bleibt die Zone um 87.787 US-Dollar. • Ethereum arbeitet sich an die Widerstandszone heran: Erst ein Tagesschluss über 3.017 US-Dollar und der 50-Tage-EMA bei 3.101 US-Dollar würde den Weg nach oben freimachen. • XRP prallt von 1,83 US-Dollar ab und steht wieder bei 1,90 US-Dollar – doch RSI und MACD sprechen weiter für Vorsicht. Nach der kräftigen Korrektur der vergangenen Woche setzt sich im Kryptomarkt eine vorsichtige Stabilisierung durch. Bitcoin, Ether und XRP bauen ihre Erholung aus, stoßen nun aber auf charttechnisch wichtige Marken, an denen sich entscheidet, ob aus der Gegenbewegung mehr wird – oder ob der nächste Rücksetzer folgt. Bitcoin: 87.787 US-Dollar bleibt der Dreh- und Angelpunkt Bitcoin hat am Montag nach der 7,48%-Korrektur der Vorwoche wieder oberhalb der Mittellinie eines horizontalen Parallelkanals bei 87.787 US-Dollar geschlossen. Am Dienstag verteidigte der Kurs diese Zone erneut, am Mittwoch notiert BTC bei rund 89.300 US-Dollar. Hält 87.787 US-Dollar als Support, rückt die obere Begrenzung des Musters bei 90.000 US-Dollar in den Fokus. Der RSI (Tag) liegt bei 45 und steigt in Richtung der neutralen 50 – ein Hinweis auf nachlassenden Verkaufsdruck. Auch der MACD entspannt sich: Die Linien nähern sich an, die roten Histogrammbalken unterhalb der Nulllinie werden schwächer. Bricht Bitcoin dagegen per Tagesschluss wieder unter 87.787 US-Dollar, bleibt die Unterseite anfällig – dann würde die nächste Auffangzone bei 85.569 US-Dollar (zugleich 78,6% Fibonacci-Retracement) wieder relevant. Ethereum: Erst über 3.017 und 3.101 US-Dollar wird es konstruktiver Ethereum startete positiv in die Woche und legte bis Dienstag um 7,62% zu – nach der 14,22%-Korrektur in der Woche davor. Am Mittwoch nähert sich ETH dem zentralen Widerstand bei 3.017 US-Dollar. Für ein klareres Erholungssignal braucht es mehr als nur Intraday-Stärke: Ein Ausbruch über 3.017 US-Dollar und ein Tagesschluss über dem 50-Tage-EMA bei 3.101 US-Dollar könnten den Blick in Richtung des Hochs vom 14. Januar bei 3.402 US-Dollar lenken. Die Momentum-Indikatoren (RSI und MACD) deuten zwar auf nachlassenden Abwärtsdruck hin, aber das Setup bleibt empfindlich. Kommt es stattdessen zu einer erneuten Abweisung an der Widerstandszone, rückt auf der Unterseite das 61,8% Fibonacci-Retracement bei 2.749 US-Dollar wieder ins Blickfeld. XRP: Rebound ja – Trendwende noch nicht XRP hat am Sonntag die tägliche Unterstützung bei 1,83 US-Dollar getestet und anschließend binnen zwei Tagen um 4,51% zugelegt. Am Mittwoch handelt der Kurs bei 1,90 US-Dollar. Solange 1,83 US-Dollar hält, kann sich die Erholung in Richtung des nächsten Widerstands bei 1,96 US-Dollar fortsetzen. Allerdings ist der Unterton noch nicht gedreht: Der RSI liegt bei 42 und damit weiter unter der neutralen 50. Zudem bleibt das Bild im MACD belastet – das bärische Crossover der Vorwoche ist weiterhin aktiv, was das Rückschlagrisiko erhöht. Fällt XRP per Tagesschluss erneut unter 1,83 US-Dollar, wäre ein weiterer Abwärtsimpuls bis zum Tief vom 19. Dezember bei 1,77 US-Dollar wieder ein realistisches Szenario.
placeholder
Solana unter Druck: SOL rutscht weiter ab und steuert auf Schlüsselstütze bei $116 zuSolana (SOL) fällt am Donnerstag rund 2% und nähert sich der Schlüsselstütze bei $116; sinkendes Open Interest ($7,42 Mrd.), negative Funding Rate (-0,0042%) und Long-Liquidationen erhöhen das Risiko eines Rutsches Richtung $100 und $95.
Autor  Mitrade Team
Do. 29.Jan
Solana (SOL) fällt am Donnerstag rund 2% und nähert sich der Schlüsselstütze bei $116; sinkendes Open Interest ($7,42 Mrd.), negative Funding Rate (-0,0042%) und Long-Liquidationen erhöhen das Risiko eines Rutsches Richtung $100 und $95.
placeholder
Gold fällt, da die Einigung über die Regierungsfinanzierung den USD stärkt und Gewinnmitnahmen auslöstGold (XAU/USD) erlebt am Freitag zum zweiten Mal in Folge eine starke Liquidation, nachdem es seit Beginn dieses Monats um mehr als 25% parabolisch gestiegen ist und in den letzten zwei Wochen eine Reihe von Rekordhochs erreicht hat.
Autor  FXStreet
Fr. 30.Jan
Gold (XAU/USD) erlebt am Freitag zum zweiten Mal in Folge eine starke Liquidation, nachdem es seit Beginn dieses Monats um mehr als 25% parabolisch gestiegen ist und in den letzten zwei Wochen eine Reihe von Rekordhochs erreicht hat.
verbundene Finanzinstrumente
goTop
quote