USD/JPY Price Analysis: Climbs steadily above 157.00

Quelle Fxstreet
  • USD/JPY trades at 157.36, up 0.22%, as BoJ keeps rates unchanged, weakening the JPY.
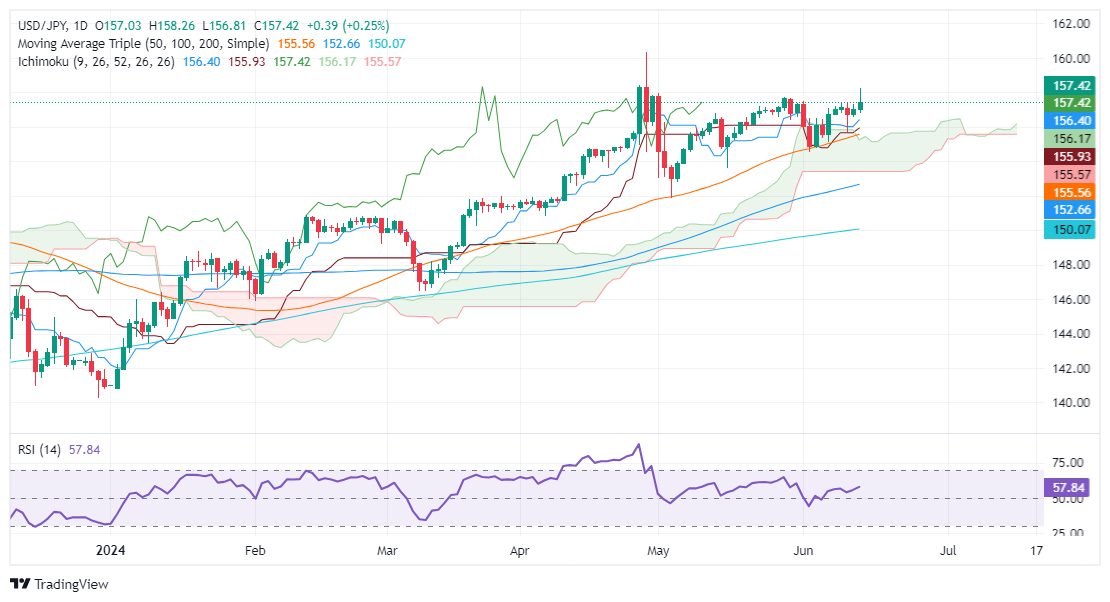
  • Technical outlook: RSI indicates bullish momentum, with key resistance levels at 158.25 and 158.44.
  • Support levels include the Tenkan-Sen at 156.00, June 12 low at 155.72, and Ichimoku Cloud low at 153.35/40.

The USD/JPY finishes the week on a higher note, registering gains of 0.22% on Friday after the Bank of Japan (BoJ) decided to hold rates unchanged, weakening the Japanese Yen (JPY). The Greenback strengthened due to risk aversion and the Wednesday Fed's hawkish hold. The pair trades at 157.36 at the time of writing.

USD/JPY Price Analysis: Technical outlook

From a technical standpoint, the USD/JPY climbs steadily, with buyers remaining in charge, as depicted by the Relative Strength Index (RSI). Momentum shows that bulls are losing steam, yet the RSI remains bullish.

The USD/JPY climbed past 157.00, and despite breaching 158.00, buyers failed to hold to its gains above the latter, which could have opened the door for further gains. If they would like to extend their profits, they must clear June’s 14 high of 158.25 before challenging the April 26 high of 158.44, ahead of 159.00. A breach of that level would clear the path to test the year-to-date (YTD) high of 160.32.

Conversely, if USD/JPY slides beneath the Tenkan-Sen at 156.00, the next stop would be June 12 low of 155.72. A breach of the latter and the pair could tumble toward the 154.00 figure, before testing the Ichimoku Cloud (Kumo) low of 153.35/40.

USD/JPY Price Action – Daily Chart

USD/JPY

Overview
Today last price 157.37
Today Daily Change 0.34
Today Daily Change % 0.22
Today daily open 157.03
 
Trends
Daily SMA20 156.6
Daily SMA50 155.45
Daily SMA100 152.57
Daily SMA200 150.02
 
Levels
Previous Daily High 157.31
Previous Daily Low 156.58
Previous Weekly High 157.47
Previous Weekly Low 154.55
Previous Monthly High 157.99
Previous Monthly Low 151.86
Daily Fibonacci 38.2% 157.03
Daily Fibonacci 61.8% 156.86
Daily Pivot Point S1 156.64
Daily Pivot Point S2 156.25
Daily Pivot Point S3 155.91
Daily Pivot Point R1 157.37
Daily Pivot Point R2 157.7
Daily Pivot Point R3 158.09


Haftungsausschluss: Nur zu Informationszwecken. Die bisherige Performance ist kein verlässlicher Indikator für zukünftige Ergebnisse.
placeholder
Solana-Ausblick: SOL dreht an der 50-Tage-EMA nach oben – ETF-Zuflüsse stabil, Privacy-Hackathon als neuer ImpulsSolana (SOL) steigt am Montag knapp 2% und erholt sich von der 50-Tage-EMA ($136). US-Spot-SOL-ETFs melden $41.08 million Wochenzuflüsse, Derivate-OI bei $8.58 billion (+4.90%). Privacy-Hackathon startet mit $75,000 Rewards; technisch rücken $145, $150 und $159 in den Fokus.
Autor  Mitrade Team
Mo. 12.Jan
Solana (SOL) steigt am Montag knapp 2% und erholt sich von der 50-Tage-EMA ($136). US-Spot-SOL-ETFs melden $41.08 million Wochenzuflüsse, Derivate-OI bei $8.58 billion (+4.90%). Privacy-Hackathon startet mit $75,000 Rewards; technisch rücken $145, $150 und $159 in den Fokus.
placeholder
Ripple-Schock: Diese Zahl entscheidet über XRP-Absturz oder RallyeXRP kommt einfach nicht vom Fleck – und genau das macht die Lage jetzt so brisant. Während viele Anleger auf den nächsten Ausbruch hoffen, tritt der Ripple-Token seit Tagen auf der Stelle. Der Kurs pendelt knapp über der psychologisch extrem wichtigen Marke von 2,00 US-Dollar.
Autor  FXStreet
Mi. 14.Jan
XRP kommt einfach nicht vom Fleck – und genau das macht die Lage jetzt so brisant. Während viele Anleger auf den nächsten Ausbruch hoffen, tritt der Ripple-Token seit Tagen auf der Stelle. Der Kurs pendelt knapp über der psychologisch extrem wichtigen Marke von 2,00 US-Dollar.
placeholder
Silberpreis-Prognose: XAG/USD pendelt um 94,50 US-Dollar nach Rückgang von neuen HöchstständenDer Silberpreis (XAG/USD) gibt nach, nachdem er ein neues Rekordhoch von 94,76 USD erreicht hat, und notiert derzeit während der europäischen Handelsstunden am Dienstag bei etwa 94,20 USD je Feinunze.
Autor  FXStreet
Di. 20.Jan
Der Silberpreis (XAG/USD) gibt nach, nachdem er ein neues Rekordhoch von 94,76 USD erreicht hat, und notiert derzeit während der europäischen Handelsstunden am Dienstag bei etwa 94,20 USD je Feinunze.
placeholder
Solana erholt sich trotz Gegenwind: ETF-Zuflüsse stützen, Futures-Daten zeigen VerkaufsüberhangSolana (SOL) steigt am Mittwoch um über 1% trotz -7% Wochenbilanz, während US-Spot-SOL-ETFs am Dienstag $3.80 million Zuflüsse (netto über $3 million) sahen, das Open Interest um 2.05% auf $7.92 billion fiel und $41.99 million Long-Liquidationen eine Sell-Side-Dominanz im Futures-Markt anzeigen.
Autor  Mitrade Team
Mi. 21.Jan
Solana (SOL) steigt am Mittwoch um über 1% trotz -7% Wochenbilanz, während US-Spot-SOL-ETFs am Dienstag $3.80 million Zuflüsse (netto über $3 million) sahen, das Open Interest um 2.05% auf $7.92 billion fiel und $41.99 million Long-Liquidationen eine Sell-Side-Dominanz im Futures-Markt anzeigen.
placeholder
Silberpreis-Prognose: XAG/USD erholt sich in Richtung 95,00 US-Dollar nahe RekordhöhenDer Silberpreis (XAG/USD) gleicht die Verluste der beiden vorhergehenden Tage aus und handelt während der europäischen Handelsstunden am Donnerstag um die 94,20 USD je Feinunze.
Autor  FXStreet
Do. 22.Jan
Der Silberpreis (XAG/USD) gleicht die Verluste der beiden vorhergehenden Tage aus und handelt während der europäischen Handelsstunden am Donnerstag um die 94,20 USD je Feinunze.
verbundene Finanzinstrumente
goTop
quote