NZD/USD Price Analysis: Bulls stuck at 0.6000 as momentum lightens

Quelle: Fxstreet
08. Mai 2024 22:13
  • Indicators on the daily chart shows decelerating bullish momentum.
  • The RSI on the hourly chart indicates fluctuating buying and selling pressures, despite its position in the positive zone.
  • For bulls to avoid losses, they must defend the key 20-day SMA.

The NZD/USD pair maintains a strong bearish bias despite recent upward movements as buyers seem to have stalled at around 0.6000 and struggle to gain further ground while momentum wanes.

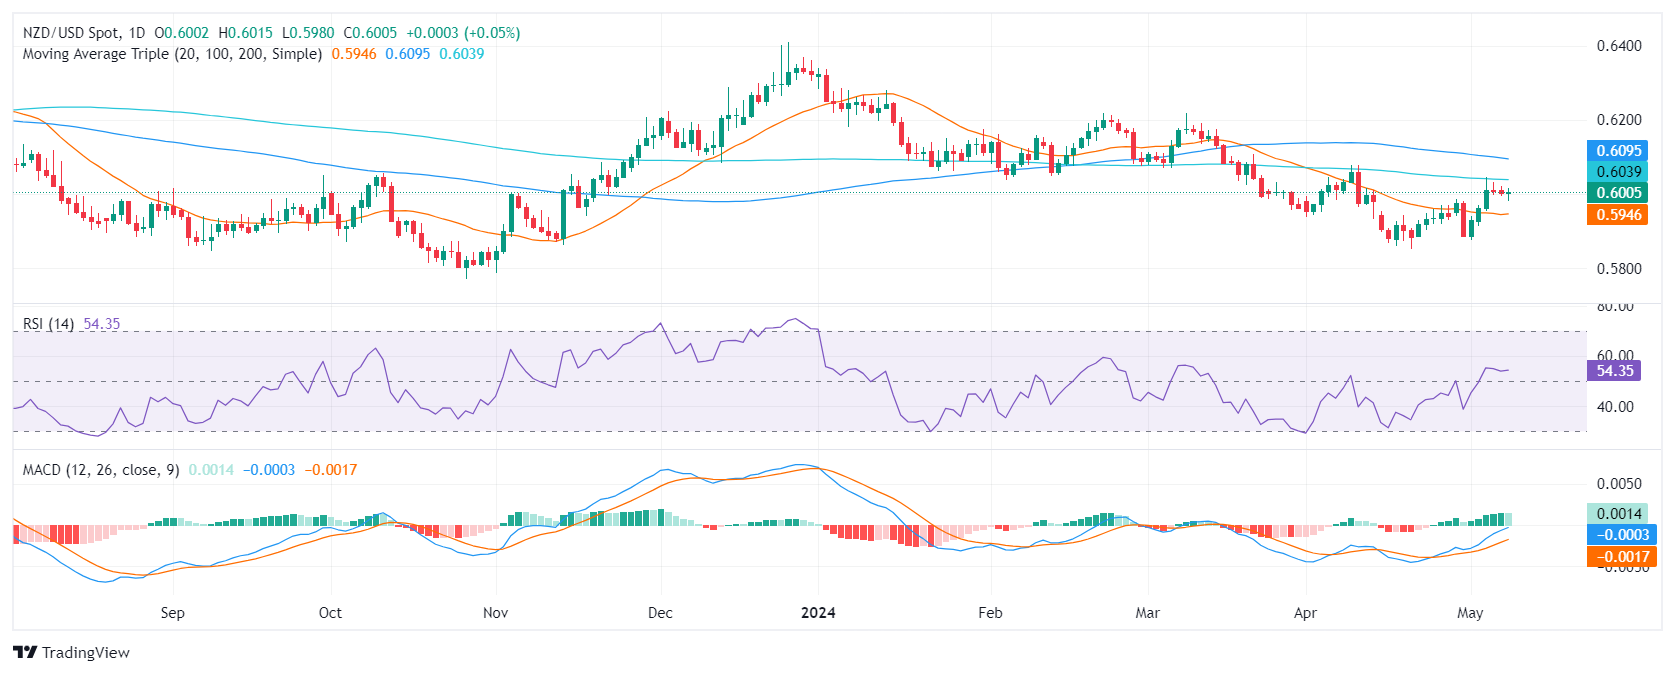
On the daily chart, technical indicators suggest a decelerating positive momentum for the pair while the prevailing downtrend persists. The Relative Strength Index (RSI) shows a positive trend after a slow ascend from the oversold region. However, the Moving Average Convergence Divergence (MACD) histogram reveals a transition towards diminishing green bars, indicating a decelerating bullish momentum.

NZD/USD daily chart
Contrastingly, the hourly RSI sits at 54. Although this is still in the positive territory, it is marginally edging lower. The past few hours have witnessed noticeable fluctuations, signaling varied buying and selling pressures. The hourly chart's MACD registers a decrease in green bars, implying receding positive momentum.

NZD/USD hourly chart
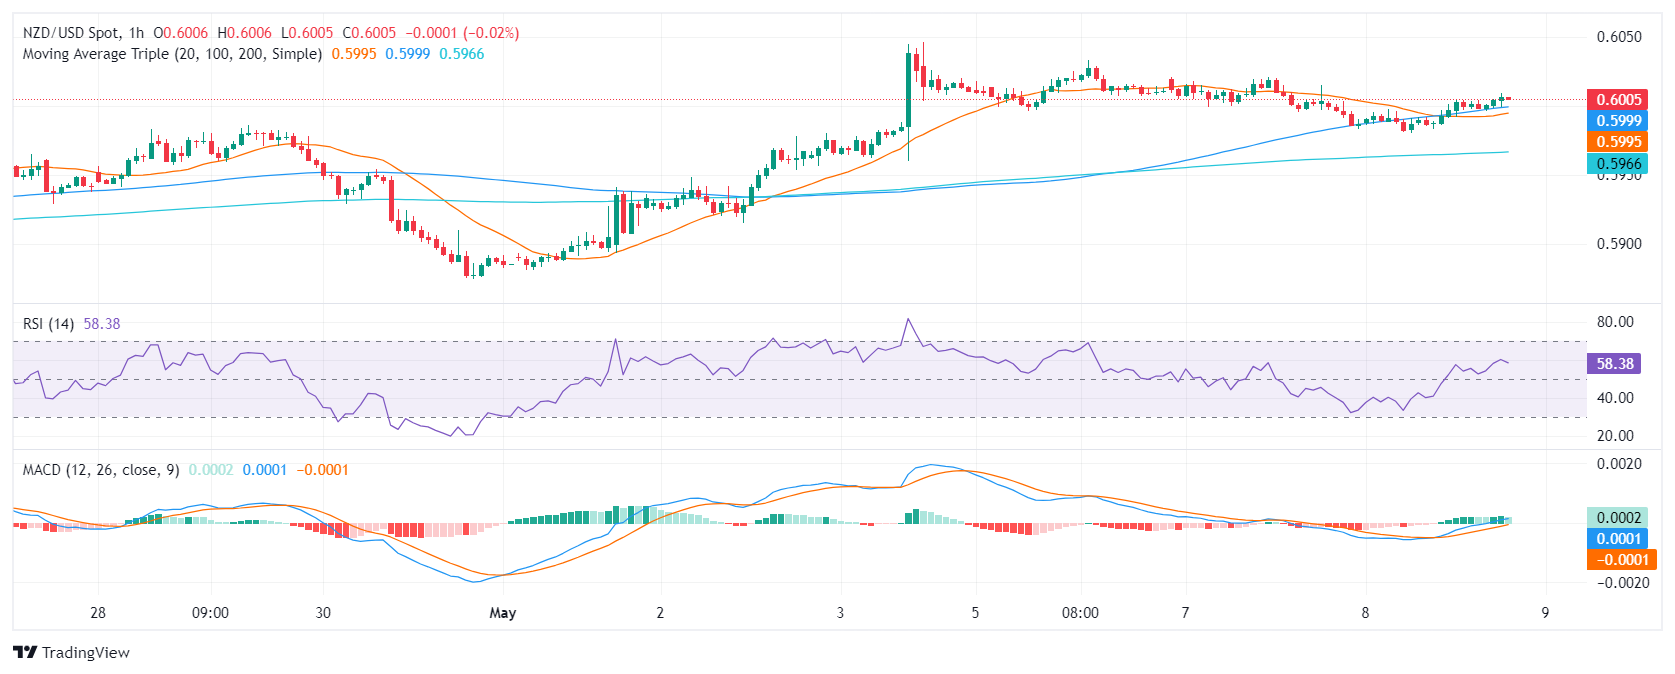
Broadening the perspective further reveals that the NZD/USD is caught in a downtrend as it lies beneath the 100 and 200-day Simple Moving Averages (SMA). That being said, its position above the 20-day average still gives some light to the bulls as it hints at a short-term positive outlook. In summary, the technical indicators of the NZD/USD pair suggest a slowing positive momentum on both the daily and hourly charts, while the prevailing downtrend continues.

NZD/USD

Overview
Today last price 0.6006
Today Daily Change 0.0004
Today Daily Change % 0.07
Today daily open 0.6002
 
Trends
Daily SMA20 0.5945
Daily SMA50 0.6016
Daily SMA100 0.6097
Daily SMA200 0.6039
 
Levels
Previous Daily High 0.6021
Previous Daily Low 0.5995
Previous Weekly High 0.6046
Previous Weekly Low 0.5875
Previous Monthly High 0.6079
Previous Monthly Low 0.5851
Daily Fibonacci 38.2% 0.6005
Daily Fibonacci 61.8% 0.6011
Daily Pivot Point S1 0.5991
Daily Pivot Point S2 0.598
Daily Pivot Point S3 0.5965
Daily Pivot Point R1 0.6017
Daily Pivot Point R2 0.6032
Daily Pivot Point R3 0.6043


Haftungsausschluss: Nur zu Informationszwecken. Die bisherige Performance ist kein verlässlicher Indikator für zukünftige Ergebnisse.
placeholder
Australian Dollar retreats from four-month highs after higher Unemployment RateThe Australian Dollar (AUD) snapped its three-day winning streak after the higher-than-expected Aussie Unemployment Rate on Thursday, which rose to 4.1% in April, from the previous reading of 3.9%.
Quelle:  Fxstreet
The Australian Dollar (AUD) snapped its three-day winning streak after the higher-than-expected Aussie Unemployment Rate on Thursday, which rose to 4.1% in April, from the previous reading of 3.9%.
placeholder
Canadian Dollar gains ground against softening Greenback as US CPI inflation coolsThe Canadian Dollar (CAD) is broadly softer on Wednesday as one of the day’s weakest performers, but the CAD will have to settle for second-worst as the US Dollar (USD) broadly retreats following a cooler-than-expected print of US Consumer Price Index (CPI) inflation.
Quelle:  Fxstreet
The Canadian Dollar (CAD) is broadly softer on Wednesday as one of the day’s weakest performers, but the CAD will have to settle for second-worst as the US Dollar (USD) broadly retreats following a cooler-than-expected print of US Consumer Price Index (CPI) inflation.
placeholder
NZD/USD attracts some buyers above 0.6060, focus on US PPI and CPI dataThe NZD/USD pair gains traction near 0.6055 on Wednesday during the early European trading hours.
Quelle:  Fxstreet
The NZD/USD pair gains traction near 0.6055 on Wednesday during the early European trading hours.
verbundene Finanzinstrumente
goTop
quote