

TSMC Falls Below $470 as Good News Materializes: How Far Will This Pullback Go?

Source Tradingkey

TradingKey - Selling Pressure Triggered as Good News Is Fully Priced In: TSMC Shares Fall Below $470 Mark; Will It Continue to Slide?

On October 8, Eastern Time, TSMC's ADR (TSM) fell by about 1.4%, losing the $470 mark to stand at $465.51. Today, TSMC announced its consolidated revenue for September at approximately NT$511.857 billion (about $16.034 billion), bringing third-quarter revenue to approximately NT$1.494 trillion, setting a new single-quarter revenue record while exceeding analysts' average expectation of NT$1.46 trillion.

Although TSMC's total revenue for the third quarter of 2026 reached another all-time high, September's monthly revenue showed a year-over-year increase but a month-over-month decline of 0.6%, triggering a wait-and-see sentiment among some short-term capital. In addition, TSMC is expected to hold its third-quarter investor conference in mid-October. Given the substantial recent gains in the stock price, some market capital chose to lock in profits ahead of the revenue release and investor conference.

On October 5, TSMC's stock price surged toward the $490 mark, touching an intraday record high of $487.47, and is currently experiencing a typical high-level pullback as good news is fully priced in. Based on a comprehensive evaluation of technicals and market positioning, TSMC's first line of defense lies at $460, and the second line of defense is at $430–$440, corresponding to the Fibonacci 0.236 and 0.382 retracement levels, respectively. The former serves as an initial support zone, while the latter is a golden ratio retracement level overlaid with a dense trading volume cluster, providing stronger support.
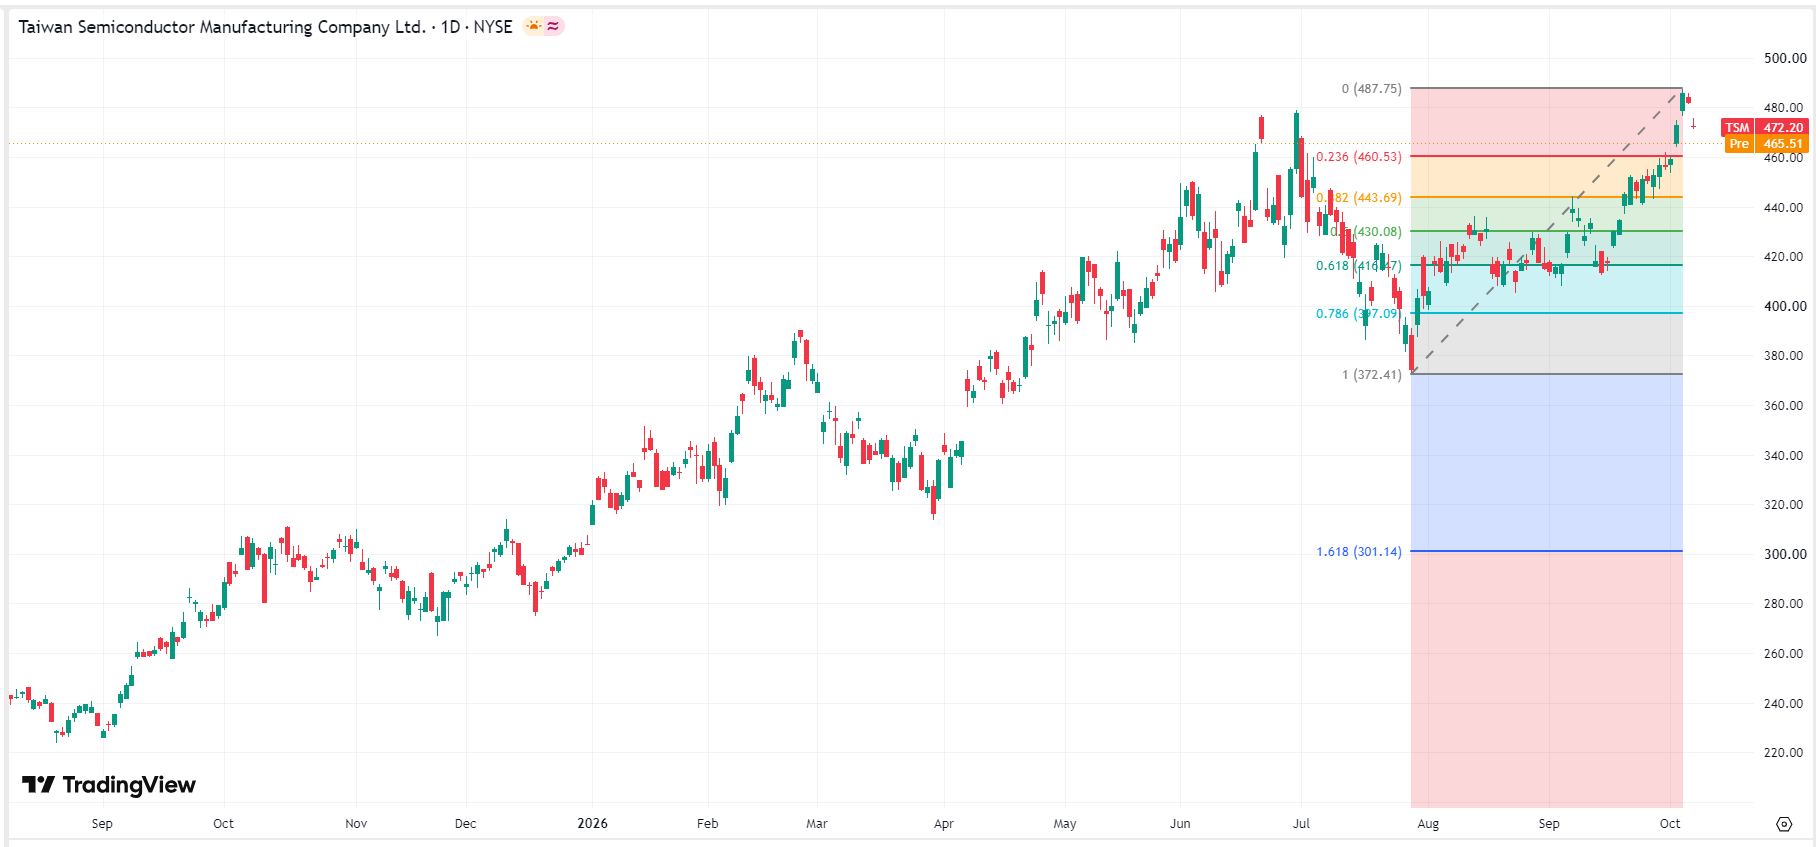
tsm-price-9fe4dfc9730941a2972cd2802df9765a

TSMC stock price chart, Source: TradingView

Therefore, short-term traders should strictly avoid blindly chasing highs or buying the dip; it is recommended to wait for TSMC's stock price to show signs of stabilizing near $450, such as a low-volume doji or a daily candlestick with a lower shadow, before considering positioning.

Disclaimer: For information purposes only. Past performance is not indicative of future results.
placeholder
XRP Price Prediction for July 2026: Can Buyers Finally Break the Downtrend?XRP (XRP) price trades near $1.05, caught between a year-long downtrend and a sudden burst of buying.July has historically rewarded XRP holders. This year the month arrives with on-chain accumulation
Author  Beincrypto
Jun 30, Tue
XRP (XRP) price trades near $1.05, caught between a year-long downtrend and a sudden burst of buying.July has historically rewarded XRP holders. This year the month arrives with on-chain accumulation
placeholder
What to Expect From Ethereum (ETH) in July 2026Ethereum (ETH) enters July 2026 trading near $1,570, close to multi-month lows, after recording its first run of three consecutive red quarterly candles in its history.On-chain data and price charts n
Author  Beincrypto
Jul 01, Wed
Ethereum (ETH) enters July 2026 trading near $1,570, close to multi-month lows, after recording its first run of three consecutive red quarterly candles in its history.On-chain data and price charts n
placeholder
XAUUSD Gold Analysis: Gold Holds Above $4,350 Ahead of US Inflation Data Is $4,500 Next? Gold holds above $4,350 following weak US jobs data. As inflation reports approach and UBS eyes $5,000, can XAUUSD break resistance at $4,435 to rally toward $4,500?
Author  Naoufal Seddik
Aug 12, Wed
Gold holds above $4,350 following weak US jobs data. As inflation reports approach and UBS eyes $5,000, can XAUUSD break resistance at $4,435 to rally toward $4,500?
placeholder
Gold Price Analysis Today: Gold Drops 1.32% Despite Lower Fed Rate-Hike Bets, Can $4,313 Support Hold? Gold fell 1.32% on August 13 after rising to $4,449.73, then reversing lower and closing near $4,349.918 below the $4,356.46 support. Softer US inflation data reduced Fed rate hike expectations, but selling pressure still dominated the session. Will $4,313 support hold?
Author  Naoufal Seddik
Aug 14, Fri
Gold fell 1.32% on August 13 after rising to $4,449.73, then reversing lower and closing near $4,349.918 below the $4,356.46 support. Softer US inflation data reduced Fed rate hike expectations, but selling pressure still dominated the session. Will $4,313 support hold?
placeholder
Gold Price Analysis Today: Gold Gains 0.94% as Markets Expect Fed to Hold Rates, Can $4,449 Resistance Break? Gold gained 0.94% on August 17, closing near $4,417.30 as softer US data strengthened expectations for unchanged Fed rates in September. Gold remains bullish, with $4,449.730 resistance and $4,310.650 support in focus.
Author  Naoufal Seddik
Aug 18, Tue
Gold gained 0.94% on August 17, closing near $4,417.30 as softer US data strengthened expectations for unchanged Fed rates in September. Gold remains bullish, with $4,449.730 resistance and $4,310.650 support in focus.
goTop
quote