


8 Years of History Warns What a September Rate Hike Could Mean for Stocks
Key Points
Since 2018, rate hikes in September haven't been bad for the market in the long run.
They were, however, not great for the market in the short run.
- 10 stocks we like better than S&P 500 Index ›
At its mid-September meeting, the Federal Reserve opted to increase interest rates, and so far, the stock market is holding up just fine. But, per the historical data, after the last two September rate hikes, the stock market fell within weeks.
That's obviously alarming for anyone invested in stocks in the S&P 500 (SNPINDEX: ^GSPC), the Nasdaq Composite (NASDAQINDEX: ^IXIC), or the Dow Jones Industrial Average (DJINDICES: ^DJI). But the last eight years of market history suggest that the damage from a September hike has tended to be temporary, so let's examine the data.
Missed AI’s "Act 1"? Act 2 Could Be 15x Bigger. Most investors think they missed the AI boat because they didn't buy Nvidia in 2005. But according to our analysts, we’re only at the end of "Act 1"—the R&D phase. "Act 2" is the global rollout. Continue »
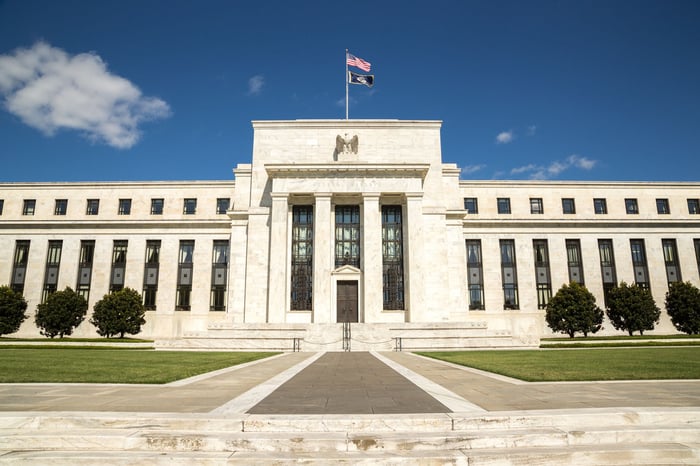
Image source: Getty Images.
The 2018 hike came before a 19% slide
The first incident we'll look at is from the rate hike in late September 2018.
The S&P 500 and the Dow both set a new record high on Sept. 20 of that year, six days before the Fed's hike. After that hike, the S&P 500 dropped 19.1% until its low just before Christmas of that year. The Fed increased rates again on Dec. 19, 2018, five days before the low.
However, the S&P 500 was up by 2.5% a year after the first hike -- not much, but enough to demonstrate that even multiple rate hikes do not equal total permanent destruction to the market, as some seem to fear at the moment.
In 2022, the lows were faster to arrive
The 2022 rate hike cycle was considerably less sunny for investors.
By the time the Fed raised rates on Sept. 21, 2022, the S&P 500 was already 21% below its January 2022 record high, as the Fed's hiking campaign, already six months old, weighed on stocks. The market reached its low on Oct. 12 of that year.
But again, by one year after the September hike, the market was 14.3% above its hike-day levels, rewarding anyone who held through the drop.
So, this is a case where the market was able to price in the headwind from rate hikes, mostly in advance.
What's different about the 2026 hike?
The 2026 setup differs from both, and there are arguments for it being worse for investors as well as better.
One dark cloud here is that long bond yields are starting the hiking cycle from a much higher point.
On Sept. 16, 2026, the 10-year Treasury yield climbed back to 5%, according to CNBC, versus about 3.1% and 3.5%, respectively, on the dates that the Fed raised rates in 2018 and 2022, per Treasury data. Each extra rate increase lands on borrowing costs that are already high.
The job market is also weaker this time. Employers added only 29,000 jobs in September 2026, and unemployment rose to 4.2%, the Bureau of Labor Statistics (BLS) reported Oct. 2, 2026. A Fed increasing interest rates into a softening job market risks overshooting, but it also has more reason to stop soon.
One upside is that stock valuations are currently somewhat less stretched than some investors fear.
The S&P 500's forward price-to-earnings (P/E) ratio is 19.2, a bit below its five-year average of 19.8. Furthermore, FactSet projects that the market will experience earnings growth of 29.1% this quarter, compared to the third quarter of 2025. Thus, the risk of rate hikes puncturing a frothy market is not as high as it may seem, though it's also true that the market is being led by a handful of megacap stocks, which aren't valued very cheaply right now.
The main thing for investors to do here is to stay calm, avoid panic-selling, and watch the Oct. 27-28 Fed meeting. After the weak jobs report, the CME's FedWatch tool indicates that the odds of a rate hike are just 20%. If the Fed hikes in December instead and long bond yields keep climbing, stocks and bonds could fall together, as in 2022.
But, both prior drops proved to be buying opportunities within a year, so be ready.
Should you buy stock in S&P 500 Index right now?
Before you buy stock in S&P 500 Index, consider this:
The Motley Fool Stock Advisor analyst team just identified what they believe are the 10 best stocks for investors to buy now… and S&P 500 Index wasn’t one of them. The 10 stocks that made the cut could produce monster returns in the coming years.
Consider when Netflix made this list on December 17, 2004... if you invested $1,000 at the time of our recommendation, you’d have $361,650!* Or when Nvidia made this list on April 15, 2005... if you invested $1,000 at the time of our recommendation, you’d have $1,437,517!*
Now, it’s worth noting Stock Advisor’s total average return is 936% — a market-crushing outperformance compared to 213% for the S&P 500. Don't miss the latest top 10 list, available with Stock Advisor, and join an investing community built by individual investors for individual investors.
See the 10 stocks »
*Stock Advisor returns as of October 5, 2026.
Alex Carchidi has no position in any of the stocks mentioned. The Motley Fool has no position in any of the stocks mentioned. The Motley Fool has a disclosure policy.
Recommended Articles


