

TRON Price Forecast: TRX Nears $0.33 After Five-Day Drop, Will It Continue to Fall?

Source Tradingkey

TradingKey - TRON Suffers 5-Day Losing Streak, Retreats to Key Defense at $0.33; Is There Still 18% Downside Ahead?

On October 10, overall cryptocurrency bulls showed weak momentum, with Bitcoin (BTC) losing $83,000 and Ethereum (ETH) falling below $2,500, triggering risk-off sentiment and profit-taking selling pressure across the crypto sector. TRON (TRX), as a top-10 major token by market capitalization, inevitably suffered from the collateral impact of tightening broad-market liquidity.

Over the past four days, TRX has remained under pressure, moving downward without any significant rebound. Today, TRX fell another 0.5% to trade at around $0.33, hitting a new low since September 16. Does this imply deteriorating TRON fundamentals and an impending trend breakdown?

Unlike most altcoins that lack practical application scenarios, TRX boasts the market's most solid cash flow and deflationary attributes, mainly reflected in: (1) The TRON network hosts over $94 billion in USDT, accounting for 54.58% of successful USDT transactions in global e-commerce and cross-border payments; (2) As users consume energy or burn TRX when transferring USDT or interacting with smart contracts on TRON, TRON's single-quarter protocol fee revenue reaches hundreds of millions of dollars. The continuous natural burning mechanism provides strong foundational value support for TRX.

Although TRON's fundamentals have not deteriorated, technical analysis indicates a high probability of a TRX pullback. In late August and late September, TRX attempted to break above $0.35 twice, both ending in failure and dashing bulls' hopes of challenging historic highs again. Currently, TRX is heading back toward its key defense line at $0.31, where the ascending trendline coincides with strong support.
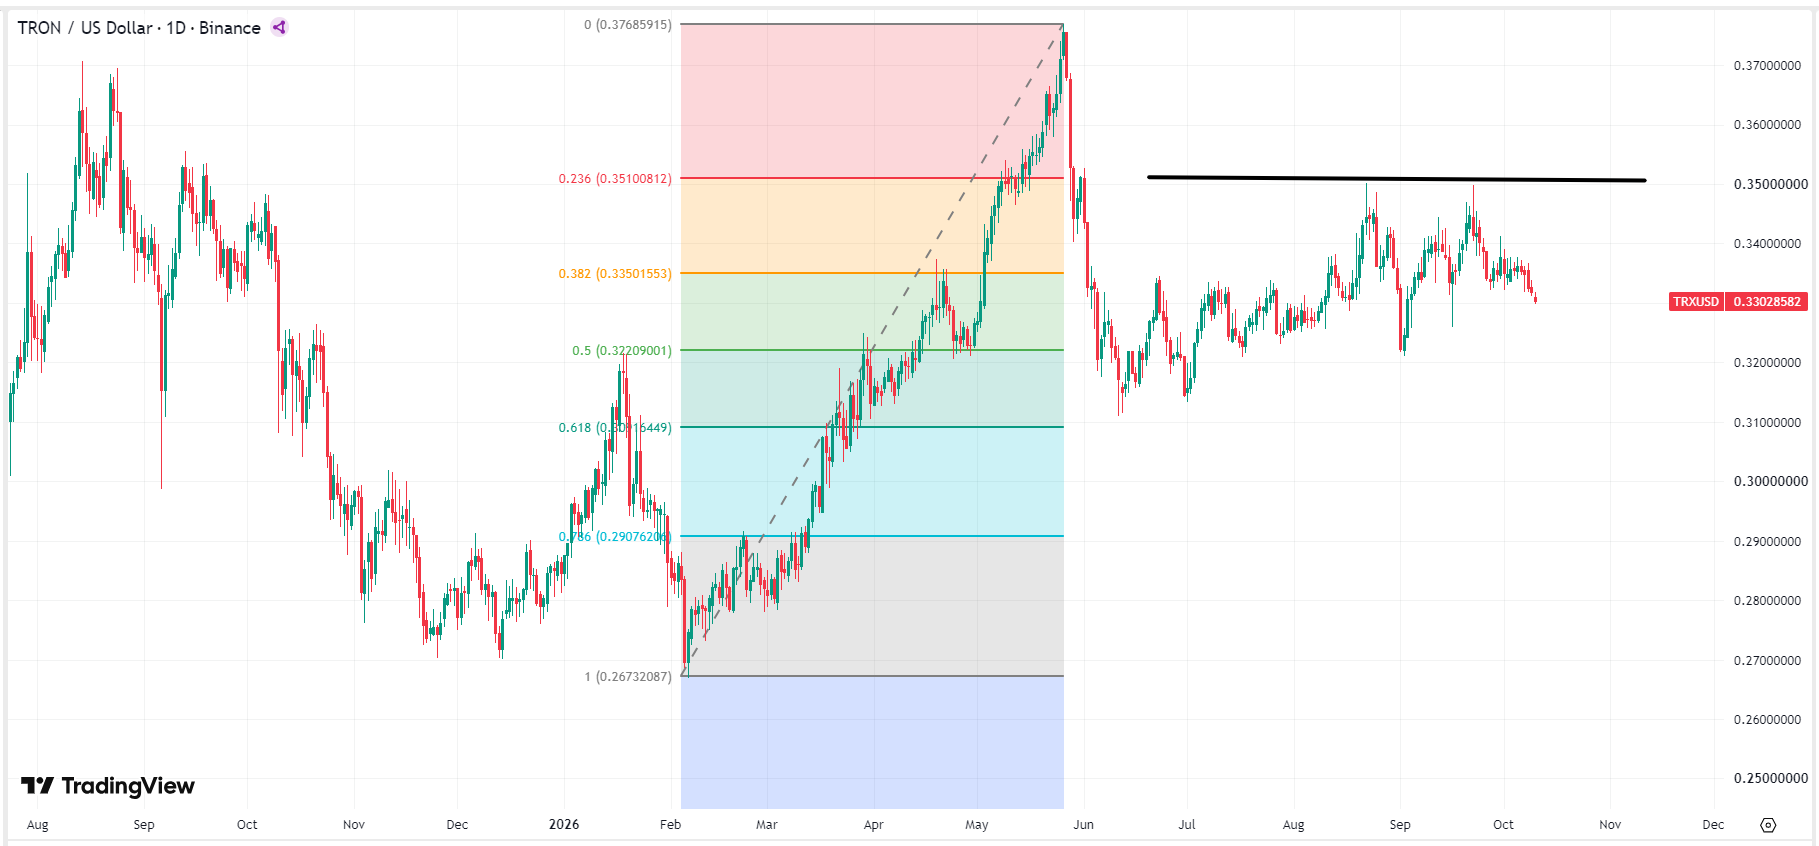
tron-trx-price-6f3dd5c5b6a94a9e9371e47b4809d776TRX price chart, source: TradingView

If TRX fails to hold $0.31, it could drop toward this year's low near $0.27, representing about 18% downside space from current levels. However, as long as it does not break below this position, there remains a short-term opportunity to follow the broader market in stabilizing and staging a right-side rebound. Therefore, the current consecutive decline can be viewed merely as bear traps or washouts within high-level consolidation.

Disclaimer: For information purposes only. Past performance is not indicative of future results.
placeholder
What to Expect From Ethereum (ETH) in July 2026Ethereum (ETH) enters July 2026 trading near $1,570, close to multi-month lows, after recording its first run of three consecutive red quarterly candles in its history.On-chain data and price charts n
Author  Beincrypto
Jul 01, Wed
Ethereum (ETH) enters July 2026 trading near $1,570, close to multi-month lows, after recording its first run of three consecutive red quarterly candles in its history.On-chain data and price charts n
placeholder
NVIDIA Price Forecast: Michael Burry Shorts NVDA, but Analysts See $299On July 1, NVIDIA (NASDAQ: NVDA) sits at $198.34, failing to break above the former support level that is now serving as resistance between $198 and $205 on the 2H chart's downward blue c
Author  TradingKey
Jul 02, Thu
On July 1, NVIDIA (NASDAQ: NVDA) sits at $198.34, failing to break above the former support level that is now serving as resistance between $198 and $205 on the 2H chart's downward blue c
placeholder
XAUUSD Gold Analysis: Gold Holds Above $4,350 Ahead of US Inflation Data Is $4,500 Next? Gold holds above $4,350 following weak US jobs data. As inflation reports approach and UBS eyes $5,000, can XAUUSD break resistance at $4,435 to rally toward $4,500?
Author  Naoufal Seddik
Aug 12, Wed
Gold holds above $4,350 following weak US jobs data. As inflation reports approach and UBS eyes $5,000, can XAUUSD break resistance at $4,435 to rally toward $4,500?
placeholder
Gold Price Analysis Today: Gold Drops 1.32% Despite Lower Fed Rate-Hike Bets, Can $4,313 Support Hold? Gold fell 1.32% on August 13 after rising to $4,449.73, then reversing lower and closing near $4,349.918 below the $4,356.46 support. Softer US inflation data reduced Fed rate hike expectations, but selling pressure still dominated the session. Will $4,313 support hold?
Author  Naoufal Seddik
Aug 14, Fri
Gold fell 1.32% on August 13 after rising to $4,449.73, then reversing lower and closing near $4,349.918 below the $4,356.46 support. Softer US inflation data reduced Fed rate hike expectations, but selling pressure still dominated the session. Will $4,313 support hold?
placeholder
Gold Price Analysis Today: Gold Gains 0.94% as Markets Expect Fed to Hold Rates, Can $4,449 Resistance Break? Gold gained 0.94% on August 17, closing near $4,417.30 as softer US data strengthened expectations for unchanged Fed rates in September. Gold remains bullish, with $4,449.730 resistance and $4,310.650 support in focus.
Author  Naoufal Seddik
Aug 18, Tue
Gold gained 0.94% on August 17, closing near $4,417.30 as softer US data strengthened expectations for unchanged Fed rates in September. Gold remains bullish, with $4,449.730 resistance and $4,310.650 support in focus.
goTop
quote