


Intel Stock Price Forecast: INTC Surges Over 9% to Cross $100 Mark, Can Bulls Push to New Highs?
TradingKey - Intel Surges Over 9% to Break $100, Can the Stock Reach a New High?
On September 8 Eastern Time, the three major U.S. stock indices generally moved lower, but Intel (INTC) staged a strong rebound against the trend, surging 9.05% to stand at $104.47, not only reclaiming the $100 psychological level, but also recording one of its largest single-day gains in recent times.
The rebound in Intel's stock price on the first trading day after U.S. Labor Day was not merely a technical bounce from oversold conditions, but rather the result of a resonance between fundamentals and catalysts. Yesterday, market rumors emerged that Intel plans to raise prices on some of its mainstream CPU products by up to 10%, which would mark its third price hike since 2025, demonstrating strong inelastic demand for x86 server CPUs in enterprise-level AI infrastructure and enhancing its gross margin and profitability outlook for the second half of 2026.
Yesterday, a prominent Wall Street institution significantly upgraded its rating and price target, further stimulating its stock price rally. Analyst Gus Richard of renowned brokerage Northland Securities upgraded Intel directly from Market Perform to Outperform and raised his price target to $120.
In addition, Trump posted an AI-generated meme on Truth Social last Sunday (September 6), depicting him sitting at a desk trading Intel stock, with the screen showing the share price surging from $20 all the way to $95, while claiming he had earned hundreds of billions of dollars for the country. Driven by this post and related market sentiment, buying interest poured in, pushing Intel's stock price higher.
Although the short-term rebound carries strong momentum, Intel still faces multiple hurdles if it is to challenge its peak of $142 set in June 2026, including fundamental, positioning, and valuation headwinds. Intel has yet to break free from the heavy capital expenditures of its foundry business, and the market is paying close attention to the commercialization progress of its foundry operations as well as its profit realization capacity in the third-quarter financial report.
Over the past five trading days, Intel's stock price has steadily risen, accumulating a gain of over 20%. It is currently approaching $107, the rebound high from late mid-month and mid-August, which serves as a key resistance level that failed to break in the previous two attempts. If it can break through with heavy volume this time, the short-term bullish pattern will be formally established, laying the groundwork for a subsequent push toward record highs.
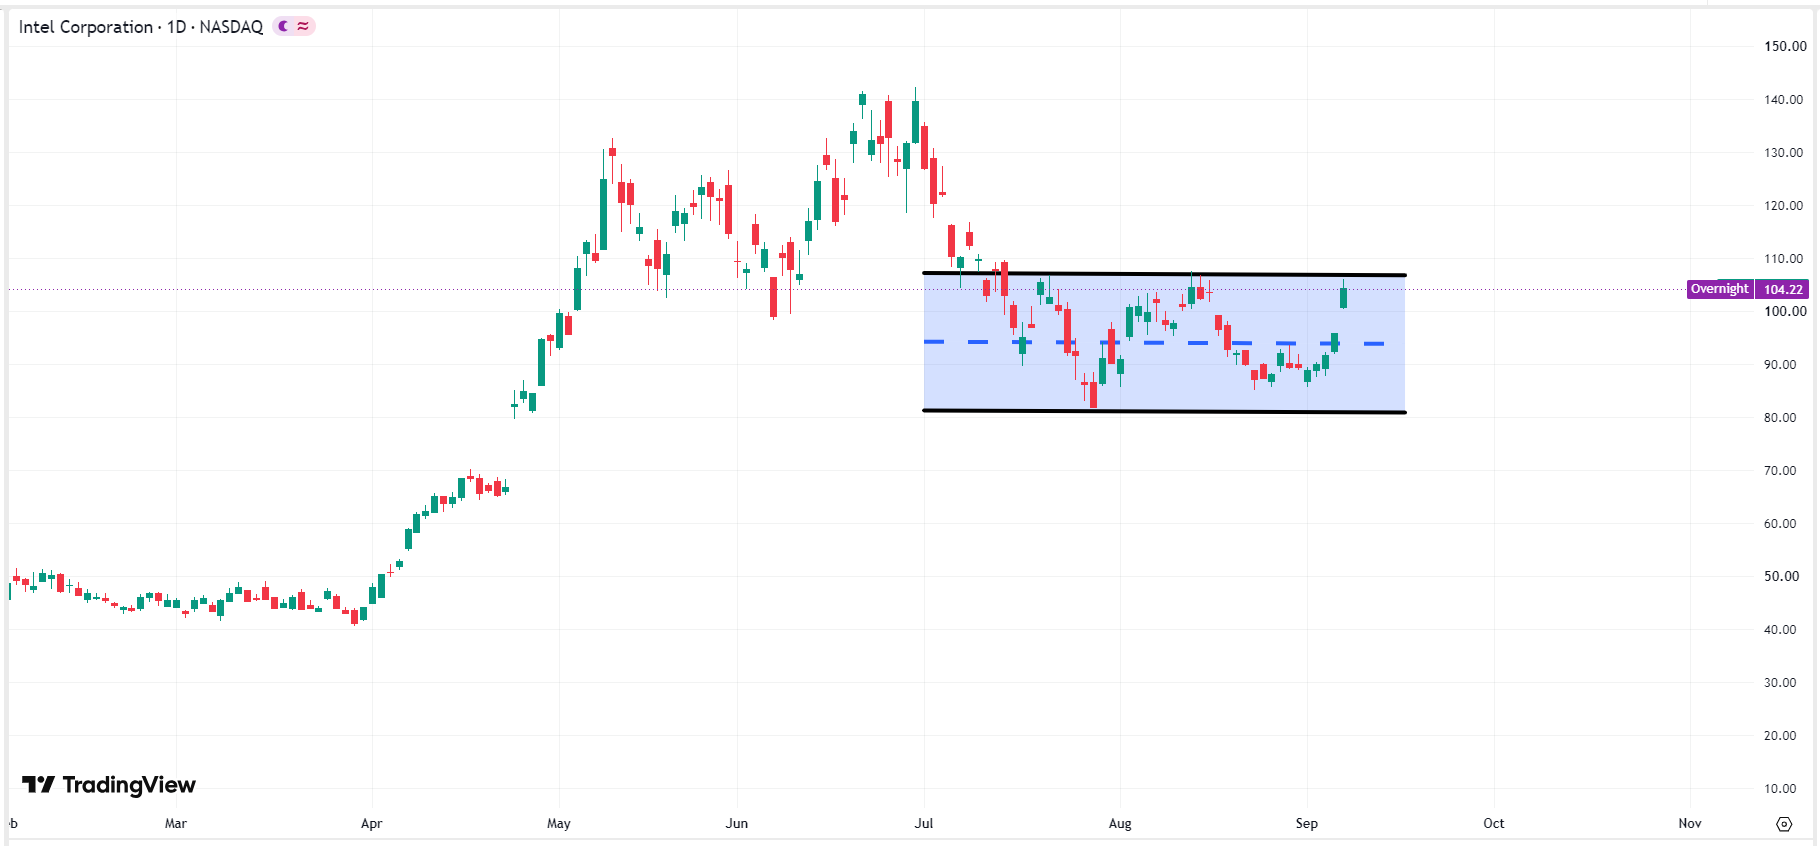 Intel stock price chart, Source: TradingView
However, if overall macroeconomic liquidity tightens or foundry capital expenditures erode short-term profit expectations, Intel's stock price could fall below $100, meaning the short-term bullish momentum is stalled, shifting into range-bound base building to test the $80 bottom once again.
Recommended Articles


