


NZD/USD Price Forecast: Rises in limited range with US CPI in focus
- NZD/USD rises to near 0.5860 as the US Dollar remains under pressure.
- The US Dollar drops even as Fed interest rate hike prospects remain firm.
- Investors keenly await the US CPI data for August.
The New Zealand Dollar (NZD) trades 0.13% higher at around 0.5860 against the US Dollar (USD) during the European trading session on Wednesday, but remains inside Tuesday's trading range. The Kiwi pair gains as the US Dollar underperforms despite Federal Reserve (Fed) interest rate hike expectations.
At press time, the US Dollar Index (DXY), which gauges the Greenback’s value against six major currencies, trades 0.2% lower to near 98.65.
US Dollar Price Today
The table below shows the percentage change of US Dollar (USD) against listed major currencies today. US Dollar was the weakest against the Japanese Yen.
| USD | EUR | GBP | JPY | CAD | AUD | NZD | CHF | |
|---|---|---|---|---|---|---|---|---|
| USD | -0.16% | -0.13% | -0.51% | -0.08% | -0.22% | -0.08% | -0.14% | |
| EUR | 0.16% | 0.03% | -0.36% | 0.07% | -0.07% | 0.08% | 0.03% | |
| GBP | 0.13% | -0.03% | -0.37% | 0.06% | -0.08% | 0.06% | 0.00% | |
| JPY | 0.51% | 0.36% | 0.37% | 0.43% | 0.29% | 0.40% | 0.38% | |
| CAD | 0.08% | -0.07% | -0.06% | -0.43% | -0.14% | -0.01% | -0.05% | |
| AUD | 0.22% | 0.07% | 0.08% | -0.29% | 0.14% | 0.15% | 0.11% | |
| NZD | 0.08% | -0.08% | -0.06% | -0.40% | 0.00% | -0.15% | -0.04% | |
| CHF | 0.14% | -0.03% | -0.01% | -0.38% | 0.05% | -0.11% | 0.04% |
The heat map shows percentage changes of major currencies against each other. The base currency is picked from the left column, while the quote currency is picked from the top row. For example, if you pick the US Dollar from the left column and move along the horizontal line to the Japanese Yen, the percentage change displayed in the box will represent USD (base)/JPY (quote).
According to the CME FedWatch tool, the odds of the Fed hiking interest rates at the policy meeting next week stand at 60%.
Meanwhile, investors keenly await the United States (US) Consumer Price Index (CPI) data for August, which will be published on Friday.
US core inflation seen contained as goods weakness offsets firm services
According to economists at TD Securities, the upcoming US CPI release is likely to show that “underlying inflation stayed under control in August,” with “the core expected to rise 0.19% m/m.” They expect “the services segment [to] be the main driver of inflation, while core goods prices likely acted as a drag, posting a modest m/m drop.” On an annual basis, TD Securities projects that “core CPI rose 2.3% on a y/y basis, down 10 bps vs July, while headline inflation likely stayed unchanged at 3.4% y/y.” The bank cautions that “we see the risks to our forecasts as skewed to the upside given that we're assuming a number of large price declines in tariff-exposed goods categories.”
NZD/USD Technical Analysis
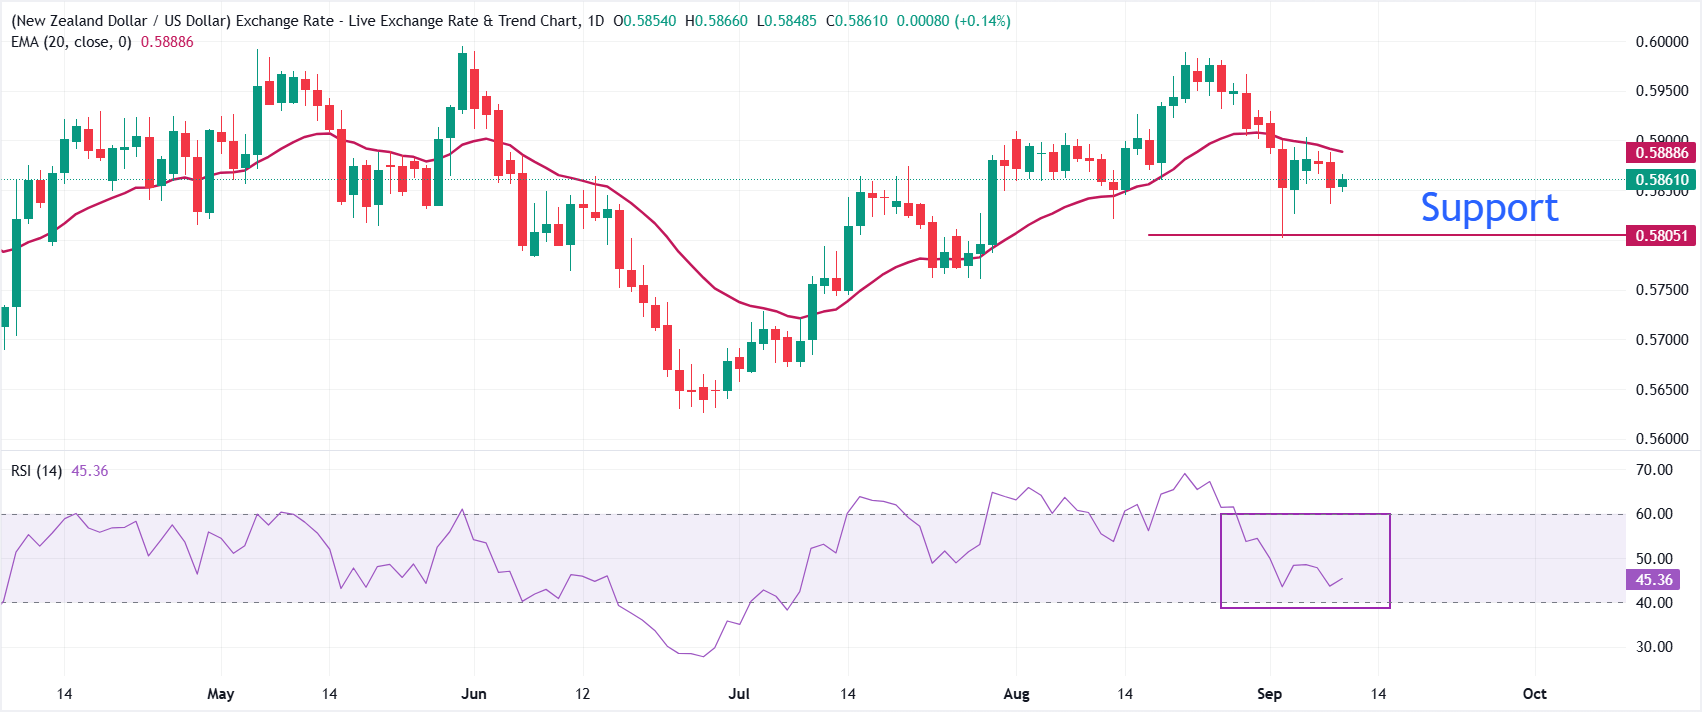
NZD/USD trades at 0.5860, holding a mildly bearish near-term bias as it sits below the 20-day exponential moving average (EMA) at 0.5889. The pair has slipped back under this short-term trend gauge, suggesting upside attempts are being capped for now, while the Relative Strength Index (RSI) around 45 points to fading bullish momentum without yet entering oversold territory.
On the topside, initial resistance is located at the 20-day EMA near 0.5890, and a daily close above this level would be needed to ease immediate downside pressure and reopen the path toward the recent highs. Looking down, the September low at 0.5802 is the key support level.
(The technical analysis of this story was written with the help of an AI tool. Know more.)
Inflation FAQs
Inflation measures the rise in the price of a representative basket of goods and services. Headline inflation is usually expressed as a percentage change on a month-on-month (MoM) and year-on-year (YoY) basis. Core inflation excludes more volatile elements such as food and fuel which can fluctuate because of geopolitical and seasonal factors. Core inflation is the figure economists focus on and is the level targeted by central banks, which are mandated to keep inflation at a manageable level, usually around 2%.
The Consumer Price Index (CPI) measures the change in prices of a basket of goods and services over a period of time. It is usually expressed as a percentage change on a month-on-month (MoM) and year-on-year (YoY) basis. Core CPI is the figure targeted by central banks as it excludes volatile food and fuel inputs. When Core CPI rises above 2% it usually results in higher interest rates and vice versa when it falls below 2%. Since higher interest rates are positive for a currency, higher inflation usually results in a stronger currency. The opposite is true when inflation falls.
Although it may seem counter-intuitive, high inflation in a country pushes up the value of its currency and vice versa for lower inflation. This is because the central bank will normally raise interest rates to combat the higher inflation, which attract more global capital inflows from investors looking for a lucrative place to park their money.
Formerly, Gold was the asset investors turned to in times of high inflation because it preserved its value, and whilst investors will often still buy Gold for its safe-haven properties in times of extreme market turmoil, this is not the case most of the time. This is because when inflation is high, central banks will put up interest rates to combat it. Higher interest rates are negative for Gold because they increase the opportunity-cost of holding Gold vis-a-vis an interest-bearing asset or placing the money in a cash deposit account. On the flipside, lower inflation tends to be positive for Gold as it brings interest rates down, making the bright metal a more viable investment alternative.
Recommended Articles


