


The Stock Market Is Closing in on Its Highest Valuation Ever. The Last Time It Got This Expensive, It Crashed.
Key Points
The stock market's valuation is nearing a potentially dangerous dot-com era territory.
At the same time, today's businesses are much stronger than many dot-com companies.
Still, extreme valuations leave little room for disappointment, and investors should be on their guard.
- 10 stocks we like better than S&P 500 Index ›
The stock market is hitting record levels on all fronts.
The S&P 500 (SNPINDEX: ^GSPC), Dow Jones Industrial Average (DJINDICES: ^DJI), and Nasdaq Composite (NASDAQINDEX: ^IXIC) have all hit record highs this year, extending a bull market that's been nearly four years in the making. If these gains hold, 2026 will mark the fourth consecutive year of double-digit returns, extending one of the strongest multi-year runs in decades. That's a record worth celebrating.
Missed Nvidia in 2009? This Rare Signal Is Flashing Again. In 2009, a "Double Down" signal flashed for a little-known chipmaker called Nvidia. For the first time in years, that same "Total Conviction" signal is flashing for a company 1/100th the size of Nvidia. Continue »
And yet there's another record the market is approaching that Wall Street might not be so eager to break.
Image source: Getty Images.
The CAPE ratio is closing in on the dot-com era record
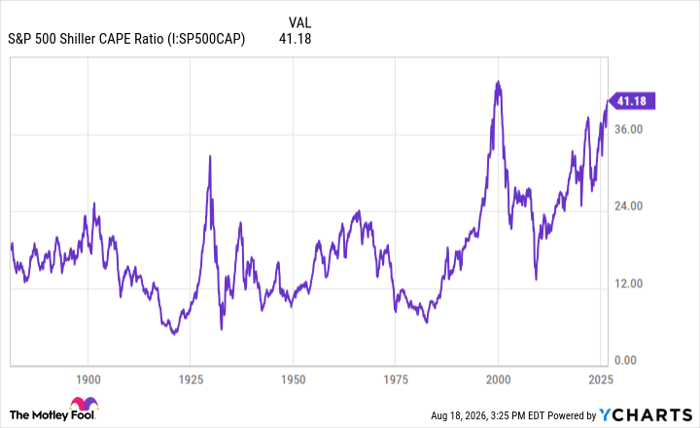
That record is the S&P 500's Shiller CAPE ratio, a measure of how expensive the stock market is relative to its earnings. In simple terms, the CAPE tells us how much investors are paying for every dollar of average inflation-adjusted earnings that the S&P 500 has produced over the last decade.
Over roughly 155 years of market history, the CAPE has averaged about 17. Today, it sits at roughly 41. This is only the second distinct period in market history in which the ratio has entered 40-plus territory; indeed, we are now only 3 points away from matching the ratio's all-time high of 44.
Data by YCharts.
When the CAPE peaked around 44, it was late 1999, and the dot-com boom was coming to a close. Many dot-com companies were priced at extraordinary valuations, and the sheer number that subsequently went bankrupt tells you how far prices had detached from fundamentals.
Today's market has similarities to the dot-com era -- the excitement over a new technology, the enormous amounts of capital being poured into it, the fear of missing out. And yet the two are not synonymous. Many of the dot-com companies had zero profits and little revenue, whereas the companies most responsible for today's rally are enormous, highly profitable enterprises. Nvidia, in other words, is no Pets.com.
At the same time, we shouldn't ignore a high CAPE ratio; indeed, few valuation metrics are better at putting today's market into historical perspective. Even great companies can become more disappointing if their high valuations leave little room for earnings to fall short of expectations. Today's market is getting uncomfortably close to that point.
To be sure, the CAPE doesn't predict crashes, nor does a 40-plus reading suggest that you sell all your stocks. What it does suggest, however, is to be selective with your investments. Now, more than ever, it's important to distinguish companies that can realistically deliver on promises from growth stocks whose valuations are being carried mostly on exuberance. If we're living in an AI bubble, companies with strong balance sheets and earnings should be better positioned to survive a crash.
Corrections, to be sure, will come and go. No one can eliminate volatility, but strong businesses and patience have historically been great remedies for the fear it can create.
Should you buy stock in S&P 500 Index right now?
Before you buy stock in S&P 500 Index, consider this:
The Motley Fool Stock Advisor analyst team just identified what they believe are the 10 best stocks for investors to buy now… and S&P 500 Index wasn’t one of them. The 10 stocks that made the cut could produce monster returns in the coming years.
Consider when Netflix made this list on December 17, 2004... if you invested $1,000 at the time of our recommendation, you’d have $432,189!* Or when Nvidia made this list on April 15, 2005... if you invested $1,000 at the time of our recommendation, you’d have $1,330,956!*
Now, it’s worth noting Stock Advisor’s total average return is 967% — a market-crushing outperformance compared to 212% for the S&P 500. Don't miss the latest top 10 list, available with Stock Advisor, and join an investing community built by individual investors for individual investors.
See the 10 stocks »
*Stock Advisor returns as of August 21, 2026.
Steven Porrello has positions in Nvidia. The Motley Fool has positions in and recommends Nvidia. The Motley Fool has a disclosure policy.
Recommended Articles


