


HCA Healthcare Inc Stock (HCA) Moved Up by 5.35% on Aug 21: Drivers Behind the Movement
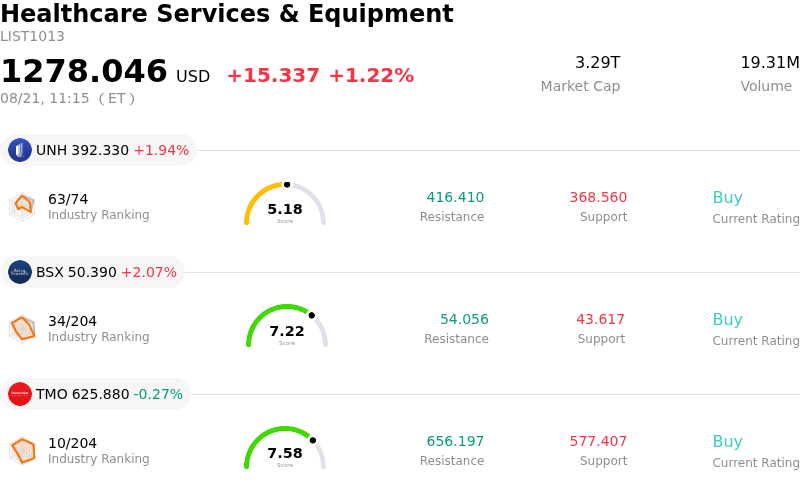
HCA Healthcare Inc (HCA) moved up by 5.35%. The Healthcare Services & Equipment sector is up by 1.22%. The company outperformed the industry. Top 3 stocks by turnover in the sector: Unitedhealth Group Inc (UNH) up 1.94%; Boston Scientific Corp (BSX) up 2.07%; Thermo Fisher Scientific Inc (TMO) down 0.27%.
What is driving HCA Healthcare Inc (HCA)’s stock price up today?
HCA Healthcare experienced a strong upward move accompanied by heightened intraday volatility, driven by a combination of favorable institutional positioning, solid core operating metrics, and positive sentiment around the company's long-term earnings trajectory. Investors responded to strong quarterly operating results that demonstrated robust patient admissions and top-line growth, reinforcing confidence in the company's ability to navigate broader healthcare cost pressures. The market continues to absorb the company's resilient patient volume trends and favorable payer mix, which provide a stable cash flow backstop in a uncertain macroeconomic backdrop.
Underpinning this price momentum is growing institutional interest and favorable analyst sentiment. Recent portfolio disclosures highlighted institutional accumulation, as investment managers added positions recognizing the stock's valuation discount relative to intrinsic cash flow models. Additionally, HCA's ongoing expansion into outpatient facilities and ambulatory care networks, alongside recent executive leadership appointments aimed at optimizing clinical and ambulatory operations, has reassured investors regarding management's strategic execution. This combination of institutional buying and strategic clarity helped fuel today's upward price movement.
From a broader market perspective, hospital operators like HCA benefit from defensive sector rotations during periods of overall equity market fluctuations. The non-discretionary nature of healthcare services and steady utilization rates offer structural resilience against economic cyclicality. While operational risks such as healthcare labor costs and contract negotiations remain active considerations, strong scale advantages, operating leverage, and capital allocation strategies such as share buybacks continue to support market confidence. Overall, the intraday rally reflects a convergence of fundamental resilience, favorable valuation dynamics, and sustained institutional support.
Technical Analysis of HCA Healthcare Inc (HCA)
Technically, HCA Healthcare Inc (HCA) shows a MACD (12,26,9) value of 1.514, indicating a buy signal. The RSI at 63.768 suggests neutral condition and the Williams %R at 5.943 suggests overbought condition. Please monitor closely.
Media Coverage of HCA Healthcare Inc (HCA)
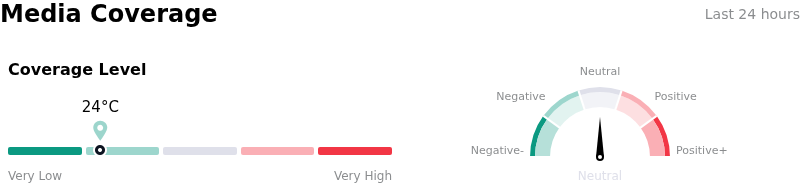
In terms of media coverage, HCA Healthcare Inc (HCA) shows a coverage score of 24, indicating a low level of media attention. The overall market sentiment index is currently in neutral zone.
Fundamental Analysis of HCA Healthcare Inc (HCA)
HCA Healthcare Inc (HCA) is in the Healthcare Services & Equipment industry. Its latest annual revenue is $75.60B, ranking 7 in the industry. The net profit is $6.78B, ranking 2 in the industry. Company Profile
Over the past month, multiple analysts have rated the company as Buy, with an average price target of $453.21, a high of $579.00, and a low of $380.00.
More details about HCA Healthcare Inc (HCA)
Company Specific Risks:
- Wall Street Price Target Cuts and Forward EPS Estimate Downgrades: Major sell-side research firms, including JPMorgan cutting its price target to $425 and Zacks lowering Q3 EPS forecasts to $6.79, have trimmed near-term financial expectations due to decelerating earnings momentum.
- Payer Mix Deterioration and Uncompensated Care Inflation: HCA expanded its projected full-year financial loss from health insurance exchange coverage drops to between $1.0 billion and $1.2 billion, driven by a 29% year-over-year surge in uncompensated care costs that directly squeezes profit margins.
- Full-Year Profit Guidance Cut and Declining Surgical Volumes: Management scaled back full-year EPS guidance to $28.70–$30.50 and trimmed Adjusted EBITDA projections, hindered by service-mix shifts and year-over-year volume contractions in both inpatient and outpatient surgical procedures.
- Persistent Wage Pressure and Medicaid Regulatory Uncertainty: Growing union pressure for increased pay and higher nurse-to-patient staffing ratios, alongside regulatory overhang surrounding potential policy changes to Medicaid state-directed supplemental payments, creates ongoing operational cost risks.
Recommended Articles


