


Walmart Q2: Beat Revenue and EPS, but US Comparable Sales Miss 2.6% as Consumer Pressure Mounts
TradingKey - Walmart (WMT) reported its Q2 FY2027 results on August 20, with revenue of $187.9 billion, up 5.9% year over year and beating analyst consensus of $186.75 billion. Adjusted EPS was also better than expected at $0.81 versus an expected $0.74. The market responded negatively and fell 9% to $103.50. It appears investors were looking past the better than expected numbers and were concerned with the tariff refunds. The core U.S. business saw sales grow by 2.6% versus the expected 3.8%, and this was the first time Walmart missed expectations in the last five years.
The primary reasons were weaker customer traffic (+1.5% compared to +3% this time last year) and weaker average transactions (+1.1% compared to +3.1% this time last year). CFO John David Rainey explained how refunds received from tariffs amounted to $2.9 billion, boosting operating income growth by about 750 basis points. This was at the expense of bottom line profitability. Management raised the full year guidelines, however conservative Q3 guidance ($0.62-0.64) versus the expected $0.68, indicated consumers are still cautious.
Earnings Verified: Revenue Beat, EPS Beat, Comps Miss
Revenue - $187.9B (+5.9%, beat $186.75B). Adjusted EPS - $0.81 vs $0.74 (+19% YoY). Operating income - +28.8%; adjusted OI - +17.4% (constant currency). U.S. comps - 2.6% (MISS 3.8%). Store traffic +1.5%, transaction growth +1.1%. Operating cash flow - $19.7B; free cash flow - $5.5B. Tariff refunds - $2.9B (750 bps OI benefit). Sam's Club U.S. comps - +4.4%; International - +7.9% constant currency. E-commerce - global +23% (US +24%, Sam's Club +26%) Advertising - +38% (Walmart Connect +43%, ex-Vizio).
Marketplace - +52%. Membership - +17%. Health & wellness comps - low single digits; pharmacy - deflation - ~900 bps (125 bps total comp drag). FY27 guidance raised to 4-5% sales, $2.80-2.87 EPS, 7-8.5% operating income growth. Q3 guidance - 3-3.75% sales, $0.62-0.64 EPS.
The Pharmacy Headwind: 125 Basis Points of Regulatory Drag
U.S. Comps are expected to be roughly 3.4%. Regulatory pricing is putting a 125 Basis Point headwind on U.S. Comps. The headwind is expected to be ongoing for the entirety of this fiscal year and into the next. Pharmacy deflation accounts for approximately 900 Basis Points within Health and Wellness, which was a low single digit decline. This is solely top line pressure as it is regulatory pricing of evolved conditions and not competitive pricing.
Consumer Weakness Signals Mounting Pressure
1.5% growth in store traffic shows concerning trends. The growth in transactions was only 1.1%, including visits that had lower expenditures. The price of gas being above $4 a gallon is placing a squeeze on lower and middle class consumers. Walmart is expecting a $2B head wind this year alone. The indication of price roll backs from Walmart suggest that management is trying to generate market share, but the reduction of their Q3 guidance implies management is not expecting a consumer led recovery anytime soon.
Bright Spots: E-Commerce, Advertising, Membership Accelerate
Global Walmart e-commerce grew 23%, and in the U.S., Walmart e-commerce is approaching 23% of their total sales (prev. 20%). Delivering store fulfill orders helps to maintain a cost advantage and improve speed. Advertising (+38%) is a high margin and no inventory trade. Membership (+17%) Represents roughly one-third of operating income, justifying Walmart's elevated 40x forward P/E valuation, but only if profitability sustains without tariff props.
Technical: Stock Breaks Key Support, Tests $102.85
WMT closed the day at $103.50 after a -9.32% drop down from $114.30. Today’s range was $102.85 to $116.00. Stock broke $106.90 support (key rising trendline). The RSI collapse to ~23, well below the 30 oversold threshold and signal line (~46), confirmed strong bearish momentum. Key support of $102.85.
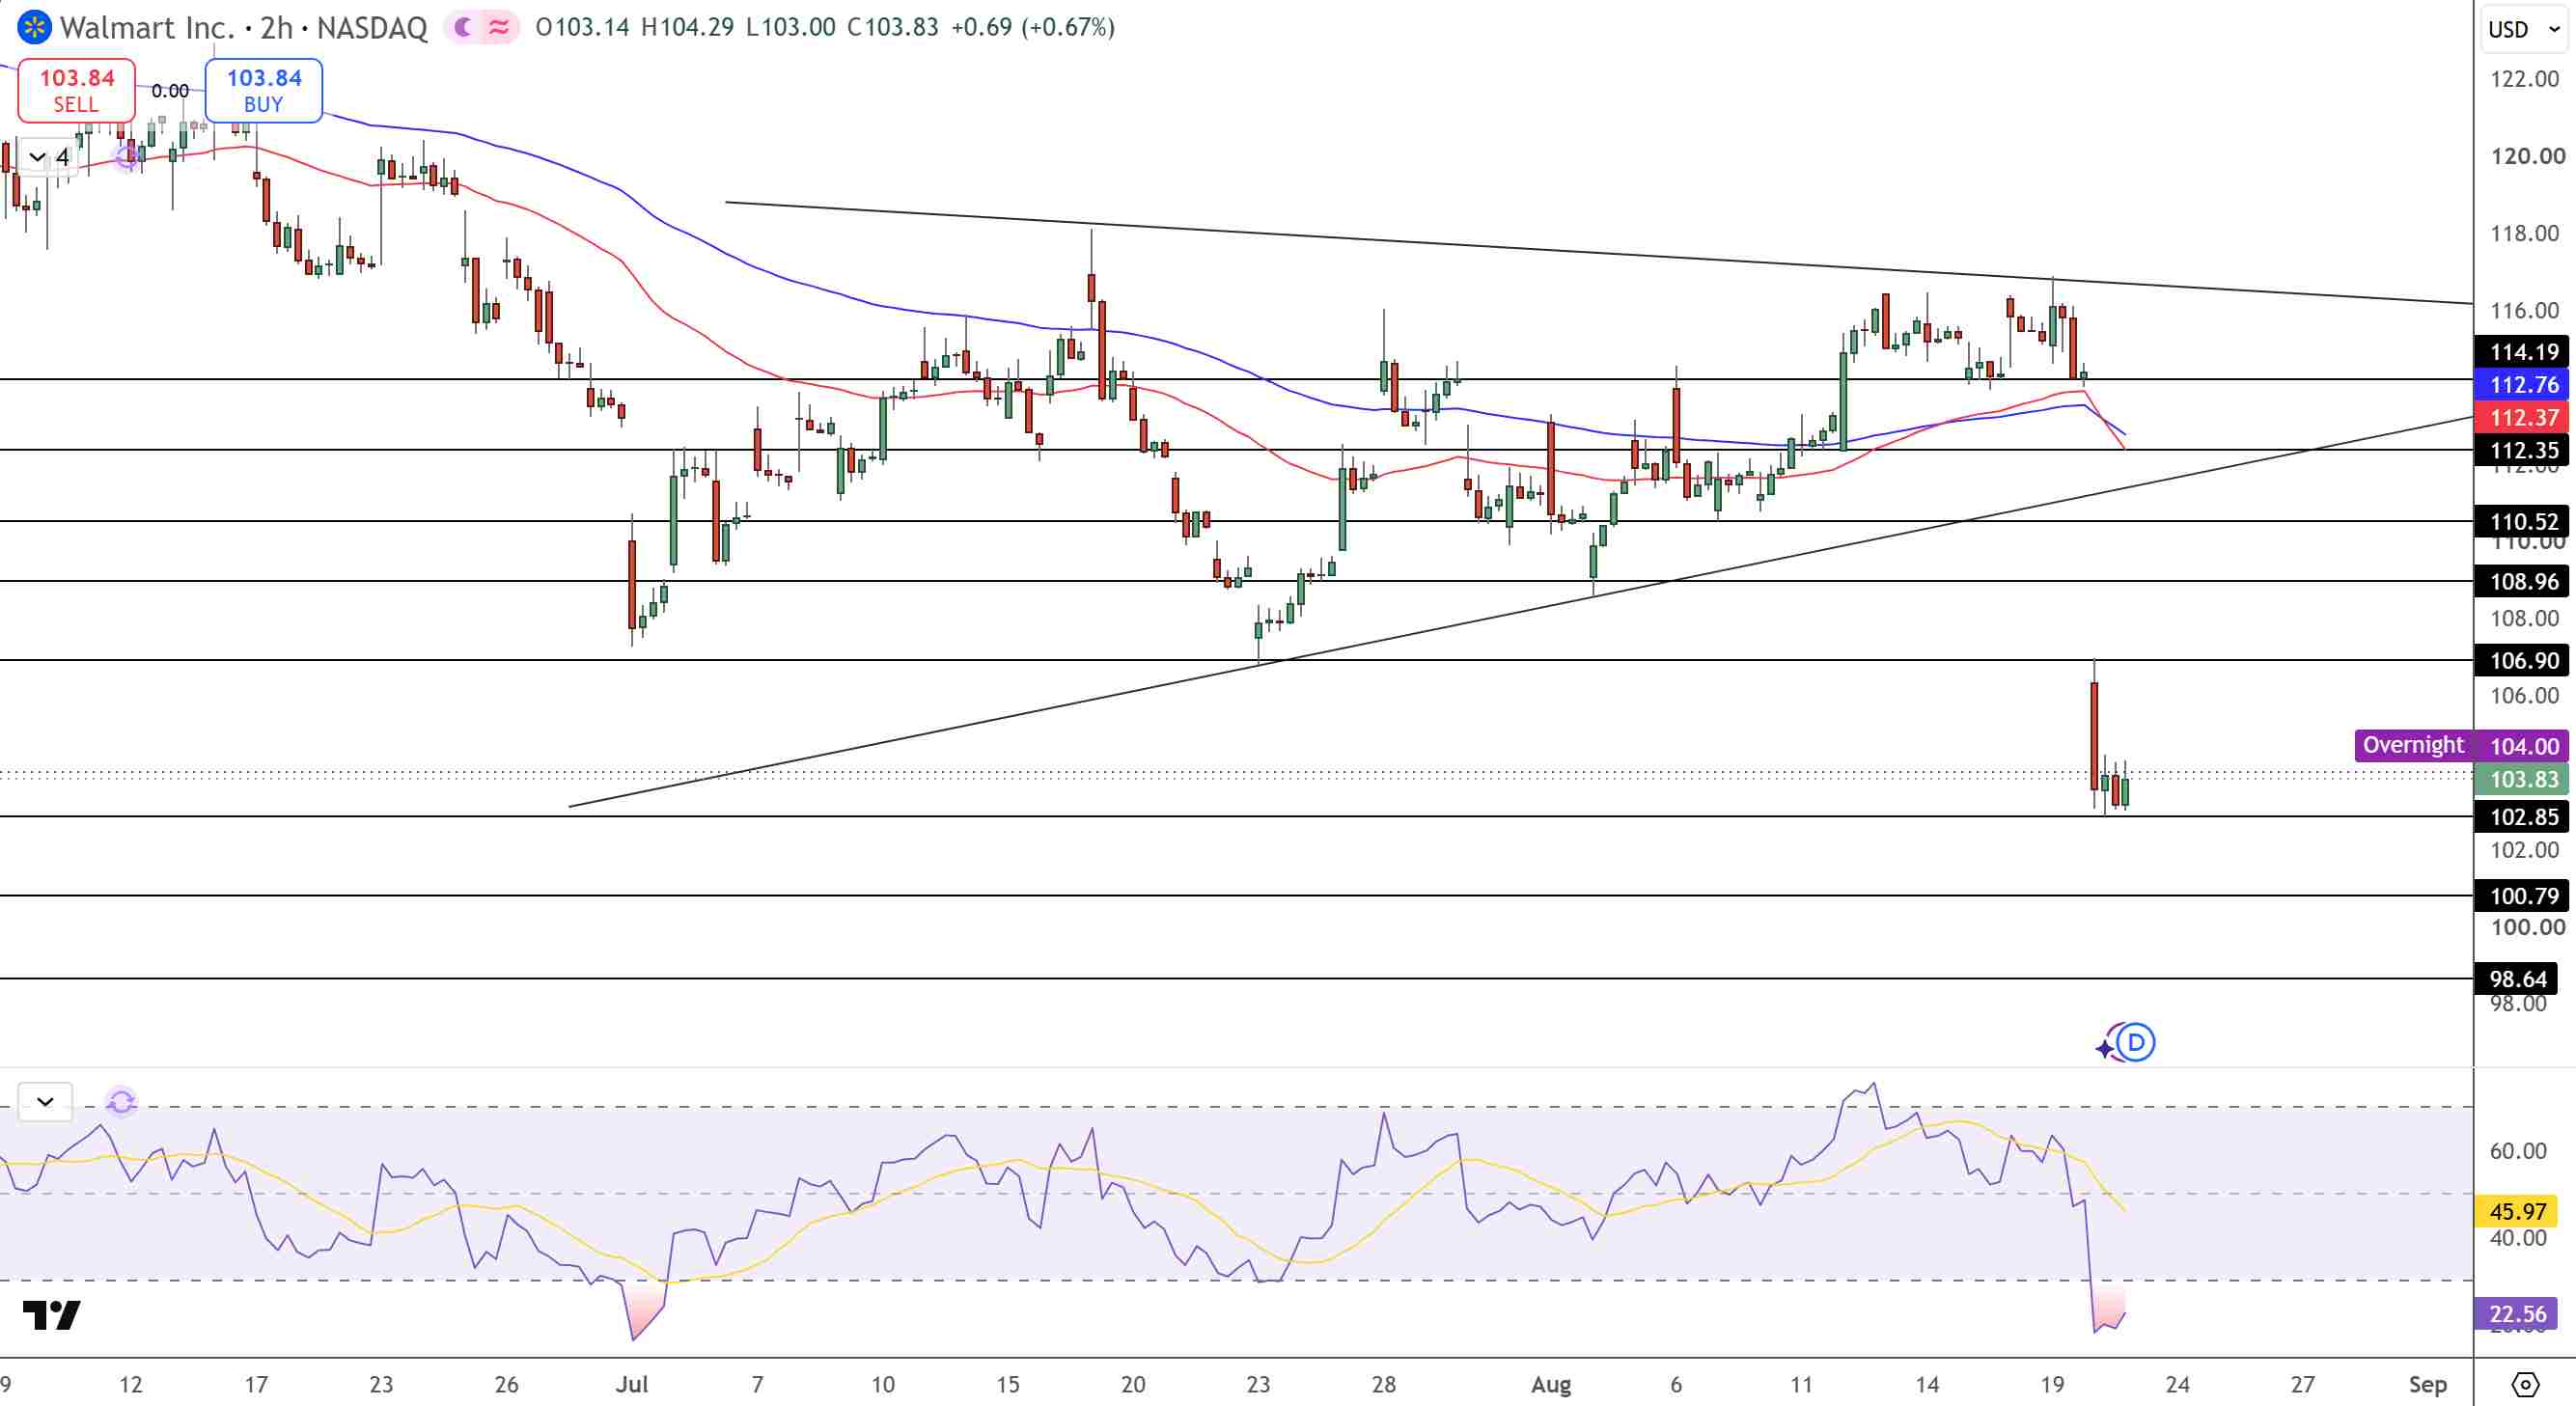
Walmart Price Chart - Source: Tradingview
If the support is broken, then $100.79 and $98.64 follow. Recovering from resistance would require $106.90 break even and then $108.96 to $110.52. The last 52-week high was $135.16 (May 19) and the last 52-week low was $95.42. Stock is at a -23% drop from May peak.
Key Technical Levels
- Immediate support: $102.85 (intraday low, critical)
- Next support: $100.79 (if $102.85 breaks)
- Breakdown target: $98.64
- First resistance: $106.90 (rising trendline)
- Next resistance: $108.96-$110.52
Bottom Line: Beat Masked by Tariff Windfall, Consumer Stress Evident
Walmart Q2: Revenue $187.9B (+5.9%, beat), EPS $0.81 (+19%, beat $0.74). US comps 2.6% (MISS 3.8%, slowest in 6 years). Pharmacy headwind 80 bps. E-commerce 23% global (+24% US). Advertising +38%. Membership +17%. Tariff refunds $2.9B (750 bps OI benefit). Guidance raised: 4-5% sales, $2.80-2.87 EPS. Q3 guidance cautious: $0.62-0.64 EPS. Fuel costs +$2B. Price rollbacks 11,000+ items.
Continual headwinds in Pharmacy revenue, 125 bps, will extend into 2028. Clearly the spending habits of consumers has diminished. The bright side of a 23% increase in e-commerce, 38% increase in advertising and 17% increase in membership is that there a high potential upside. Whether these high valuations are justified is highly debatable especially when the technical breakdown is severe ($102.85 critical support).
A caution approach is justified after the guidance for Q3 was reduced. The Jackson Hole Fed commentary on Aug 27-29 will be important to note for the confidence of consumers. Please note, this all analysis and not investment advice.
Recommended Articles


