

SpaceX Stock Price Forecast: Drops Below IPO Price Again, May Pull Back Toward $100 in the Short Term

Source Tradingkey

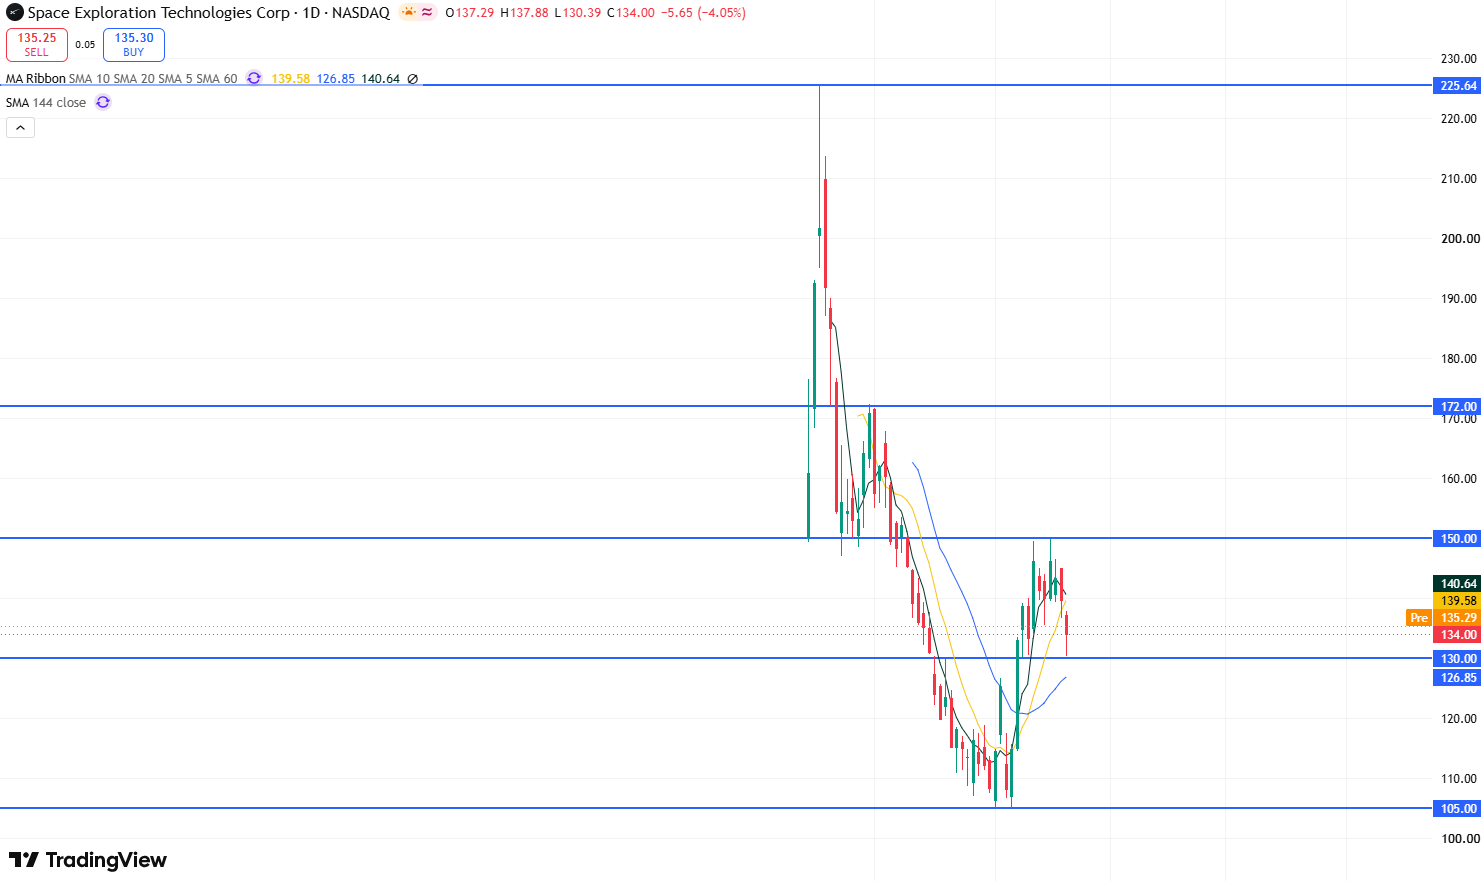
TradingKey - As of the US market close on August 20 Eastern Time, SpaceX (SPCX) shares weakened again, falling 4.05% on the day to $134, touching an intraday low of $130.39 and falling back below its $135 IPO price. Over the past three weeks, SPCX shares rebounded from around $105 to $150, but came under pressure and pulled back below $150 this week, showing that the rally from the late-July low has encountered pressure once again.
spcx-27a5be1359834d3ea0f71b37b6016bbd

SPCX daily stock chart, Source: TradingView

Looking at the daily chart of SPCX stock, the share price has recently tested the key resistance level of $150 twice in succession, both failing to achieve an effective breakout. This indicates strong resistance and severe market selling pressure at this level, which in turn weighed on the stock price this week.

Currently, the stock price has fallen to above the $130 support level. If it stabilizes at this level, the stock price may continue to test the $150 resistance level on the upside. If it can break through and hold firmly above $150, upside potential toward $172 will open up, with the possibility of even testing the $200 mark.

Conversely, if the stock price breaks below the $130 support level, short-term bearish momentum will build significantly, and the stock price may pull back toward the $120-$125 range. If it breaks further below $120, the stock price may drop toward the $105 support level, or even further toward the $100 mark.

Disclaimer: For information purposes only. Past performance is not indicative of future results.
placeholder
XRP Price Prediction for July 2026: Can Buyers Finally Break the Downtrend?XRP (XRP) price trades near $1.05, caught between a year-long downtrend and a sudden burst of buying.July has historically rewarded XRP holders. This year the month arrives with on-chain accumulation
Author  Beincrypto
Jun 30, Tue
XRP (XRP) price trades near $1.05, caught between a year-long downtrend and a sudden burst of buying.July has historically rewarded XRP holders. This year the month arrives with on-chain accumulation
placeholder
XAUUSD Gold Analysis: Gold Holds Above $4,350 Ahead of US Inflation Data Is $4,500 Next? Gold holds above $4,350 following weak US jobs data. As inflation reports approach and UBS eyes $5,000, can XAUUSD break resistance at $4,435 to rally toward $4,500?
Author  Naoufal Seddik
Aug 12, Wed
Gold holds above $4,350 following weak US jobs data. As inflation reports approach and UBS eyes $5,000, can XAUUSD break resistance at $4,435 to rally toward $4,500?
placeholder
Gold Price Analysis Today: Gold Drops 1.32% Despite Lower Fed Rate-Hike Bets, Can $4,313 Support Hold? Gold fell 1.32% on August 13 after rising to $4,449.73, then reversing lower and closing near $4,349.918 below the $4,356.46 support. Softer US inflation data reduced Fed rate hike expectations, but selling pressure still dominated the session. Will $4,313 support hold?
Author  Naoufal Seddik
Aug 14, Fri
Gold fell 1.32% on August 13 after rising to $4,449.73, then reversing lower and closing near $4,349.918 below the $4,356.46 support. Softer US inflation data reduced Fed rate hike expectations, but selling pressure still dominated the session. Will $4,313 support hold?
placeholder
Gold Price Analysis Today: Gold Gains 0.94% as Markets Expect Fed to Hold Rates, Can $4,449 Resistance Break? Gold gained 0.94% on August 17, closing near $4,417.30 as softer US data strengthened expectations for unchanged Fed rates in September. Gold remains bullish, with $4,449.730 resistance and $4,310.650 support in focus.
Author  Naoufal Seddik
Aug 18, Tue
Gold gained 0.94% on August 17, closing near $4,417.30 as softer US data strengthened expectations for unchanged Fed rates in September. Gold remains bullish, with $4,449.730 resistance and $4,310.650 support in focus.
placeholder
Gold Price Analysis Today: Gold Rebounds After 1.91% Drop as Yields Ease. Is $4,449 Next? Gold fell about 1.91% on August 18 before producing a strong bullish reaction from the 1-hour demand zone in early August 19 trading. RSI is recovering from oversold conditions, but Supertrend remains bearish as traders await the Fed minutes.
Author  Naoufal Seddik
Aug 19, Wed
Gold fell about 1.91% on August 18 before producing a strong bullish reaction from the 1-hour demand zone in early August 19 trading. RSI is recovering from oversold conditions, but Supertrend remains bearish as traders await the Fed minutes.
goTop
quote