

Nvidia Stock Forecast: Faces Three-Day Selloff, Could Fall Another 18% Before Earnings

Source Tradingkey

TradingKey - Selling pressure mounts on Nvidia ahead of earnings, with technicals suggesting a potential 18% decline to around $180.

On August 19 ET, Nvidia (NVDA) shares rebounded slightly, trading around $219.59, temporarily halting a three-day losing streak. Yesterday, soaring U.S. Treasury yields hit high-valuation tech stocks. As one of the largest market-cap giants in U.S. equities, Nvidia became the top choice for large institutions to take profits and hedge liquidity, causing its share price to drop over 2% and reversing recent gains into losses.

Currently, the market is closely watching the mass production and delivery schedule of the new Blackwell architecture chips. Some institutions worry that initial supply chain yields and assembly complexity could weigh on gross margins in the short term, prompting short-term capital to step aside and wait on the sidelines. Meanwhile, the market is closely watching the free cash flow burn rate of major customers such as Microsoft, Meta, and Google on AI server deployment, raising concerns that overexpansion could lead to a temporary digestion period for Nvidia's procurement.

In addition, the options market shows that implied volatility around the earnings release projects a massive price swing of 8% to 12% in either direction. To avoid the risk of a potential "sell the news" event even if earnings are positive, some short-term capital and quantitative funds (CTAs) have chosen to proactively trim positions ahead of the report, resulting in precautionary selling.

From a technical perspective, Nvidia's recent attempt to hit a new all-time high ended in failure, with the rebound peak lower than the historical peak, forming a descending channel—a classic bearish pattern. Yesterday, Nvidia's shares gapped down and may continue downward to search for support ahead of its earnings release on August 26. The first support level is the middle band around $200. If that level fails to hold, the stock will head toward the second line of defense at the lower band near $180, representing approximately 18% downside from current levels.
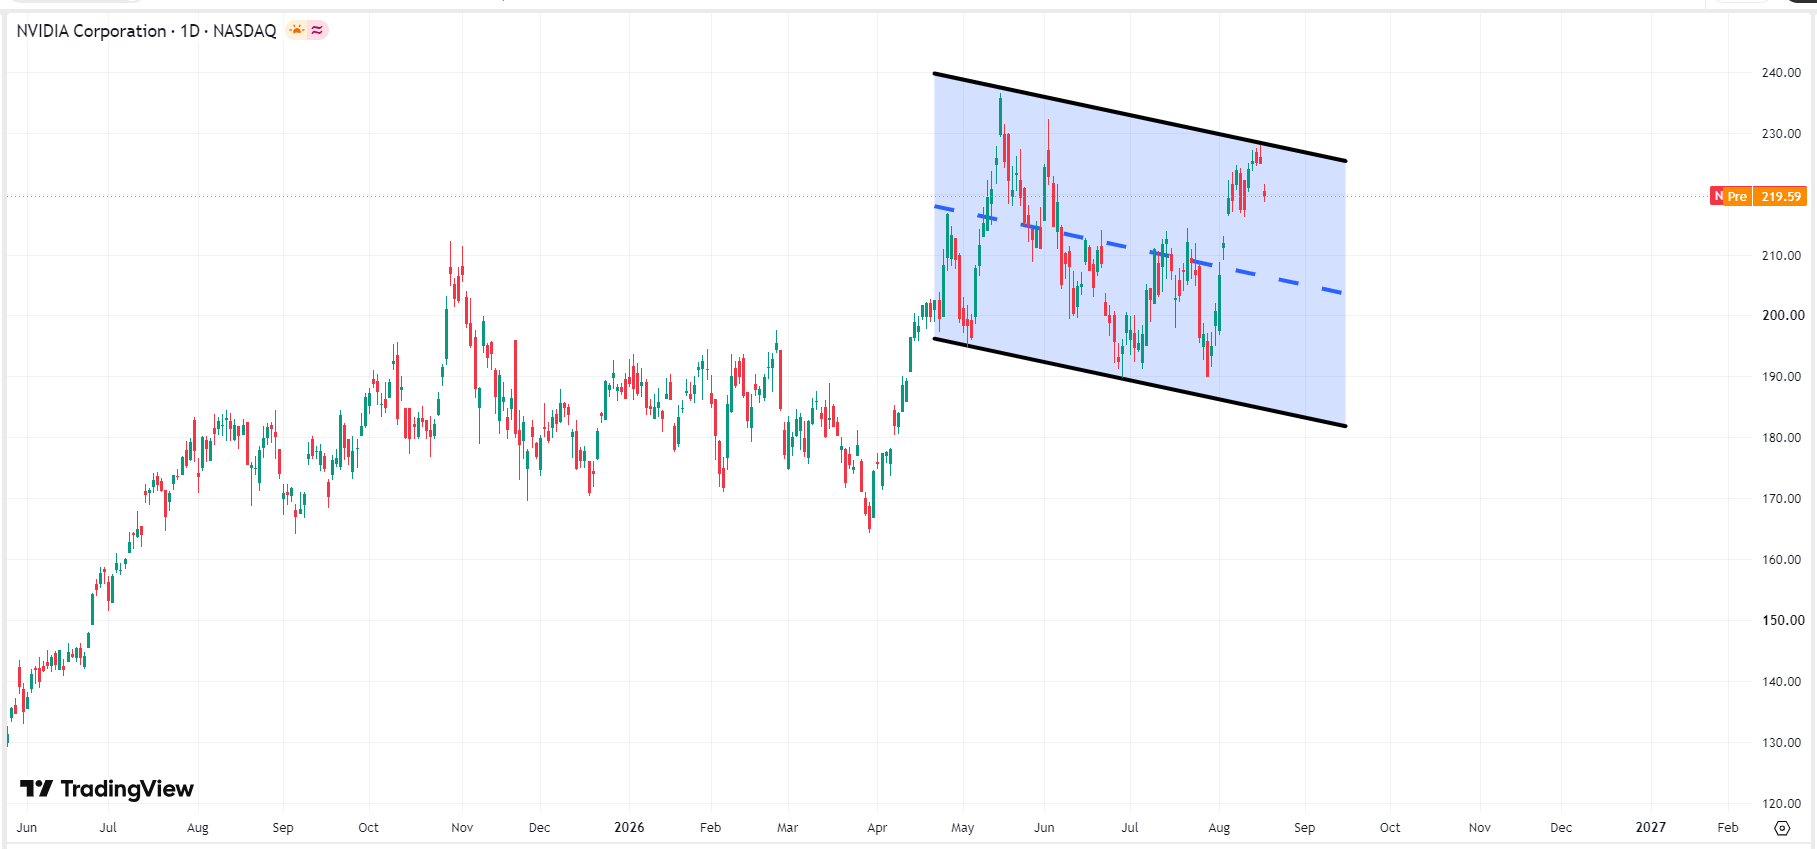
nvidia-nvda-price-a2924ee4d14f432089b2180388502e95Nvidia stock chart, Source: TradingView

Disclaimer: For information purposes only. Past performance is not indicative of future results.
placeholder
XRP Price Prediction for July 2026: Can Buyers Finally Break the Downtrend?XRP (XRP) price trades near $1.05, caught between a year-long downtrend and a sudden burst of buying.July has historically rewarded XRP holders. This year the month arrives with on-chain accumulation
Author  Beincrypto
Jun 30, Tue
XRP (XRP) price trades near $1.05, caught between a year-long downtrend and a sudden burst of buying.July has historically rewarded XRP holders. This year the month arrives with on-chain accumulation
placeholder
XAUUSD Gold Analysis: Gold Holds Above $4,350 Ahead of US Inflation Data Is $4,500 Next? Gold holds above $4,350 following weak US jobs data. As inflation reports approach and UBS eyes $5,000, can XAUUSD break resistance at $4,435 to rally toward $4,500?
Author  Naoufal Seddik
Aug 12, Wed
Gold holds above $4,350 following weak US jobs data. As inflation reports approach and UBS eyes $5,000, can XAUUSD break resistance at $4,435 to rally toward $4,500?
placeholder
Gold Price Analysis Today: Gold Drops 1.32% Despite Lower Fed Rate-Hike Bets, Can $4,313 Support Hold? Gold fell 1.32% on August 13 after rising to $4,449.73, then reversing lower and closing near $4,349.918 below the $4,356.46 support. Softer US inflation data reduced Fed rate hike expectations, but selling pressure still dominated the session. Will $4,313 support hold?
Author  Naoufal Seddik
Aug 14, Fri
Gold fell 1.32% on August 13 after rising to $4,449.73, then reversing lower and closing near $4,349.918 below the $4,356.46 support. Softer US inflation data reduced Fed rate hike expectations, but selling pressure still dominated the session. Will $4,313 support hold?
placeholder
Gold Price Analysis Today: Gold Gains 0.94% as Markets Expect Fed to Hold Rates, Can $4,449 Resistance Break? Gold gained 0.94% on August 17, closing near $4,417.30 as softer US data strengthened expectations for unchanged Fed rates in September. Gold remains bullish, with $4,449.730 resistance and $4,310.650 support in focus.
Author  Naoufal Seddik
Yesterday 07: 02
Gold gained 0.94% on August 17, closing near $4,417.30 as softer US data strengthened expectations for unchanged Fed rates in September. Gold remains bullish, with $4,449.730 resistance and $4,310.650 support in focus.
placeholder
Gold Price Analysis Today: Gold Rebounds After 1.91% Drop as Yields Ease. Is $4,449 Next? Gold fell about 1.91% on August 18 before producing a strong bullish reaction from the 1-hour demand zone in early August 19 trading. RSI is recovering from oversold conditions, but Supertrend remains bearish as traders await the Fed minutes.
Author  Naoufal Seddik
9 hours ago
Gold fell about 1.91% on August 18 before producing a strong bullish reaction from the 1-hour demand zone in early August 19 trading. RSI is recovering from oversold conditions, but Supertrend remains bearish as traders await the Fed minutes.
goTop
quote