


Lam Research Corp Stock (LRCX) Moved Down by 4.50% on Aug 19: A Full Analysis
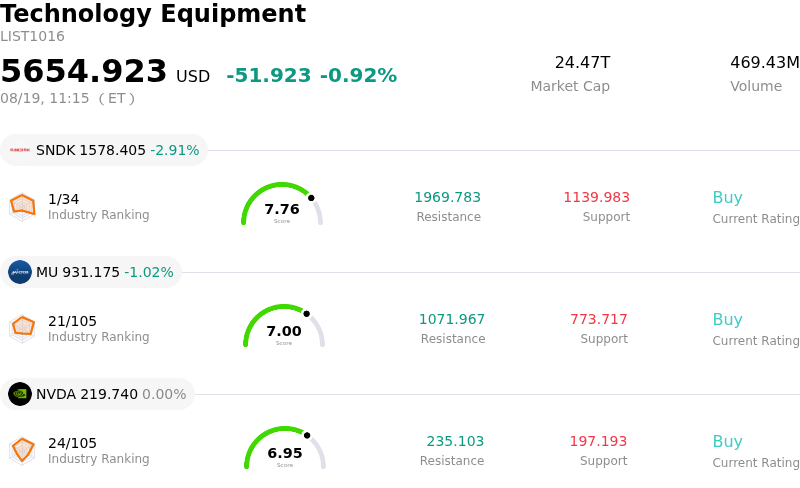
Lam Research Corp (LRCX) moved down by 4.50%. The Technology Equipment sector is down by 0.92%. The company underperformed the industry. Top 3 stocks by turnover in the sector: SanDisk Corporation (SNDK) down 2.91%; Micron Technology Inc (MU) down 1.02%; NVIDIA Corp (NVDA) up 0.00%.
What is driving Lam Research Corp (LRCX)’s stock price down today?
Lam Research experienced downward price pressure and heightened intraday volatility as profit-taking swept through the semiconductor capital equipment sector following a extended rally. After reporting robust quarterly financial results and raising full-year wafer fabrication equipment spending expectations on strong demand for artificial intelligence, advanced packaging, and memory tools, the stock reached elevated valuation multiples relative to historical averages and broader industry peers. This expanded multiple left equity shares particularly sensitive to macro profit-taking and portfolio rebalancing across high-beta technology names ahead of key upcoming earnings catalysts across the broader semiconductor supply chain.
Market participants are also weighing short-term financial commitments against long-term strategic positioning. While the company recently announced plans to invest billions of dollars over the next five years to expand its global research and development lab network, institutional investors are carefully evaluating the near-term margin impact of increased capital expenditure and operating expenses. Although these investments are critical for securing market share in next-generation high-bandwidth memory and complex etch and deposition processes, elevated near-term spending expectations can create temporary friction during periods of market consolidation.
Institutional portfolio adjustments and insider trading disclosures have further contributed to trading dynamics. Recent regulatory filings indicated selective position trimming by institutional asset managers taking profits after significant outperformance earlier in the summer, alongside pre-planned insider sales executed under standard trading programs. While long-term fundamentals remain supported by artificial intelligence infrastructure expansion and technology node transitions, these institutional supply flows, combined with ongoing geopolitical export control considerations surrounding international shipments, added pressure to the stock during the session.
Technical Analysis of Lam Research Corp (LRCX)
Technically, Lam Research Corp (LRCX) shows a MACD (12,26,9) value of 11.215, indicating a neutral signal. The RSI at 52.310 suggests neutral condition and the Williams %R at 25.367 suggests buy condition. Please monitor closely.
Media Coverage of Lam Research Corp (LRCX)
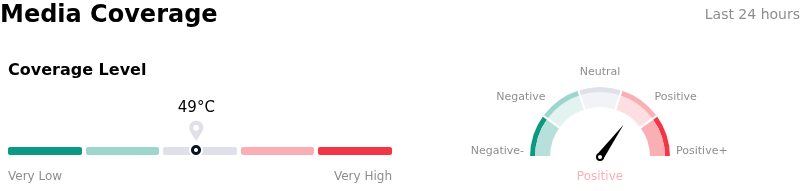
In terms of media coverage, Lam Research Corp (LRCX) shows a coverage score of 49, indicating a moderate level of media attention. The overall market sentiment index is currently in bullish zone.
Fundamental Analysis of Lam Research Corp (LRCX)
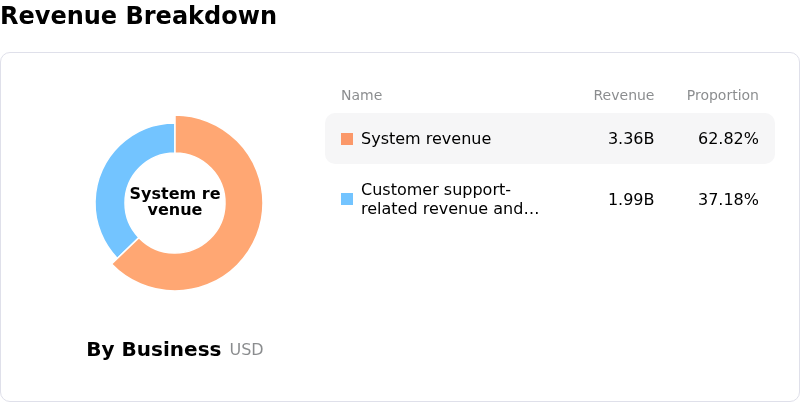
Lam Research Corp (LRCX) is in the Technology Equipment industry. Its latest annual revenue is $23.23B, ranking 12 in the industry. The net profit is $7.27B, ranking 7 in the industry. Company Profile
Over the past month, multiple analysts have rated the company as Buy, with an average price target of $366.38, a high of $500.00, and a low of $213.00.
More details about Lam Research Corp (LRCX)
Company Specific Risks:
- Stretched Valuation Premium and Correction Risk: Following a rapid stock rally, Lam Research trades at a forward P/E of approximately 35.8x and a TTM P/E near 58.5x—substantially above its 5-year historical median of 23.3x—leaving the stock vulnerable to profit-taking and multiple compression if growth rates moderate.
- Capital Expenditure Burden from Global R&D Expansion: The company announced a major commitment to invest over $3 billion over the next five years to expand its global R&D lab network, alongside ongoing facility expansions in Malaysia, imposing heavy near-term capital expenditure commitments that could weigh on free cash flow and operating margins.
- Heavy Executive Insider Sales Disclosures: SEC Form 4 and Form 144 regulatory filings disclosed substantial executive share liquidations, including President and CEO Timothy Archer exercising options and selling 30,000 common shares worth $9 million, reflecting an absence of insider buying at current price levels.
- Geopolitical and China Export Control Exposure: As highlighted in its annual Form 10-K SEC filing, Lam Research remains heavily exposed to U.S. export restrictions and trade policy constraints on semiconductor equipment sales to domestic Chinese customers, creating ongoing risks of order pushbacks and top-line volatility.
Recommended Articles


