


Home Depot Inc Stock (HD) Moved Up by 3.25% on Aug 19: What Signal Does It Send?
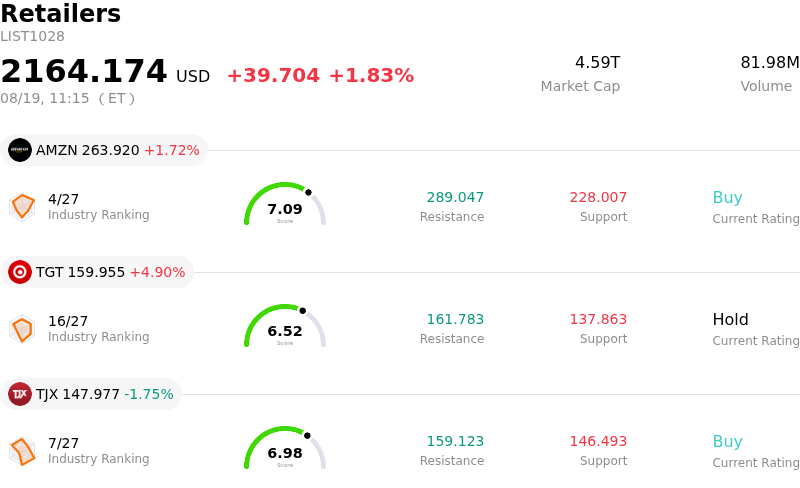
Home Depot Inc (HD) moved up by 3.25%. The Retailers sector is up by 1.83%. The company outperformed the industry. Top 3 stocks by turnover in the sector: Amazon.com Inc (AMZN) up 1.72%; Target Corp (TGT) up 4.90%; TJX Companies Inc (TJX) down 1.75%.
What is driving Home Depot Inc (HD)’s stock price up today?
Home Depot shares moved notably higher following the release of the company's second-quarter fiscal 2026 financial results, which surpassed Wall Street expectations on both the top and bottom lines. Net sales expanded year over year to reach solid seasonal levels, supported by positive global and domestic comparable store sales growth that marked a meaningful acceleration from prior quarters. Adjusted earnings per share easily cleared consensus estimates, driven by steady customer spending on core home improvement categories and solid operational execution despite high mortgage rates constraining overall housing turnover.
A key driver behind the market enthusiasm was the strength in Home Depot's professional contractor segment and digital channels. Investments in the professional ecosystem, including the strategic integration of major specialty distribution acquisitions such as SRS Distribution and Gypsum Management & Supply, allowed the company to capture market share among professional builders and tradespeople. Additionally, digital same-store sales maintained strong double-digit growth for the fifth consecutive quarter, reflecting enhanced omnichannel capabilities such as express delivery initiatives. While consumers deferred large-scale remodeling projects due to macroeconomic pressures, steady demand for routine maintenance and smaller home projects drove higher average ticket sizes across the majority of merchandising departments.
Investor sentiment was further bolstered by management reaffirming its full-year fiscal 2026 financial outlook. Despite ongoing macroeconomic volatility and elevated input costs, Home Depot reaffirmed targets for total sales growth and comparable store sales. Gross margin performance benefited from significant tariff refunds under the International Emergency Economic Powers Act, which helped offset headwinds from rising fuel, energy, and freight costs throughout the fiscal year. The firm's ability to maintain its margin outlook and profitability targets underscored effective cost management and cash flow generation, which management utilized to support dividend payments and reduce corporate debt.
Wall Street analysts responded constructively to the results, highlighting Home Depot's competitive moat in the home improvement retail space relative to broader industry peers. Positive earnings revisions and maintained buy ratings from major brokerage firms reinforced institutional confidence in the company's long-term market strategy. As market participants digested the resilient operational update, buying momentum strengthened, driving a solid gain as investors positioned into high-quality retail names with proven market share momentum and defensive cash flows.
Technical Analysis of Home Depot Inc (HD)
Technically, Home Depot Inc (HD) shows a MACD (12,26,9) value of -2.425, indicating a neutral signal. The RSI at 46.838 suggests neutral condition and the Williams %R at 70.590 suggests sell condition. Please monitor closely.
Media Coverage of Home Depot Inc (HD)
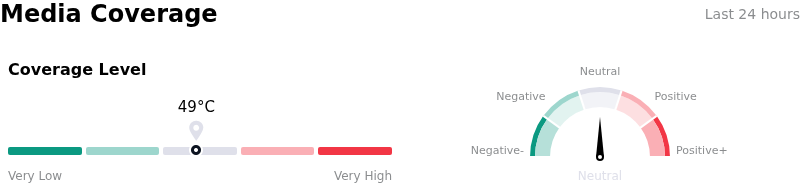
In terms of media coverage, Home Depot Inc (HD) shows a coverage score of 49, indicating a moderate level of media attention. The overall market sentiment index is currently in neutral zone.
Fundamental Analysis of Home Depot Inc (HD)
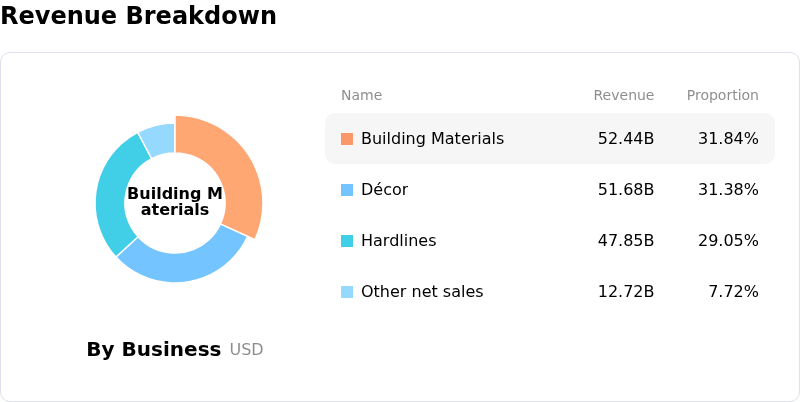
Home Depot Inc (HD) is in the Retailers industry. Its latest annual revenue is $164.68B, ranking 1 in the industry. The net profit is $14.16B, ranking 1 in the industry. Company Profile
Over the past month, multiple analysts have rated the company as Buy, with an average price target of $0.00, a high of $0.00, and a low of $0.00.
More details about Home Depot Inc (HD)
Company Specific Risks:
- Housing Headwinds and Shrinking Customer Transactions: Persistent weakness in home turnover and elevated mortgage rates continue to suppress high-ticket remodeling projects; despite an average ticket increase in Q2, comparable customer transaction volume dropped 1.0%, highlighting underlying consumer caution and reduced foot traffic.
- Executive Leadership Disruption: The unexpected announcement of Chief Executive Officer Edward P. Decker taking a temporary medical leave creates key-person dependency risks and management uncertainty during a pivotal operational window, forcing interim co-management of day-to-day operations.
- Cost Inflation and Reliance on Tariff Refunds: Reaffirmed full-year guidance relies heavily on temporary IEEPA tariff refunds to cushion profit margins against unplanned fuel, energy, and product input cost inflation, creating risk of margin compression once one-time refunds expire.
- Integration Expenses and Cash Flow Pressure: Ongoing integration costs, higher intangible asset amortization, and elevated debt loads tied to recent major acquisitions (such as SRS Distribution) are weighing on operating leverage and balance sheet flexibility amid ongoing macroeconomic uncertainty.
Recommended Articles


