


Caterpillar Inc Stock (CAT) Moved Down by 3.26% on Aug 19: What Investors Need To Know
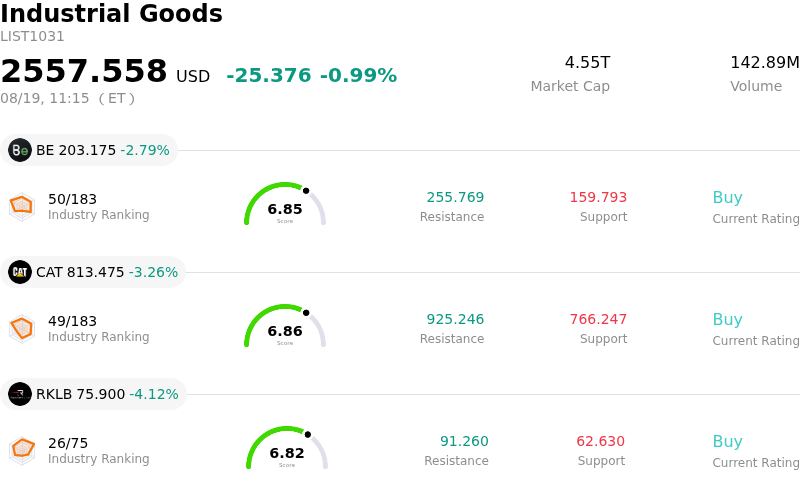
Caterpillar Inc (CAT) moved down by 3.26%. The Industrial Goods sector is down by 0.99%. The company underperformed the industry. Top 3 stocks by turnover in the sector: Bloom Energy Corp (BE) down 2.79%; Caterpillar Inc (CAT) down 3.26%; Rocket Lab USA Inc (RKLB) down 4.12%.
What is driving Caterpillar Inc (CAT)’s stock price down today?
Caterpillar experienced downward momentum and heightened intraday volatility as broader industrial sentiment cooled and investors continued to lock in gains following a powerful post-earnings rally. The heavy equipment giant had recently reported historic quarterly results, significantly topping revenue and profitability expectations driven by unprecedented demand for power generation equipment and a massive order backlog. However, with the stock having advanced substantially over recent months to trade at a premium valuation multiple relative to historical averages, market participants opted to reduce exposure, leading to increased selling pressure across trading sessions.
A primary catalyst influencing institutional sentiment is the emergence of regulatory headwinds surrounding artificial intelligence infrastructure. Heightened scrutiny over energy grid capacity—including state-level moratoriums and electric grid approval audits—has introduced near-term uncertainty regarding the pacing of new data center buildouts. Because Caterpillar’s Energy and Transportation segment has served as a key growth engine by supplying large diesel and natural gas engines for data center backup power, potential regulatory slowdowns in project approvals have raised questions about the near-term order cadence in power generation markets.
Operational considerations and broader macroeconomic conditions are further compounding the pullback. Investors are scrutinizing potential delivery bottlenecks associated with extended equipment lead times stretching multiple years into the future, alongside management projections of dealer inventory reductions in the construction division later this year. While Caterpillar’s substantial backlog and elevated full-year outlook demonstrate underlying fundamental strength, the combination of elevated expectations, supply chain execution risks, and sector-wide profit-taking in high-valuation industrial plays has driven short-term downward volatility.
Technical Analysis of Caterpillar Inc (CAT)
Technically, Caterpillar Inc (CAT) shows a MACD (12,26,9) value of 9.386, indicating a neutral signal. The RSI at 43.931 suggests neutral condition and the Williams %R at 70.604 suggests sell condition. Please monitor closely.
Media Coverage of Caterpillar Inc (CAT)
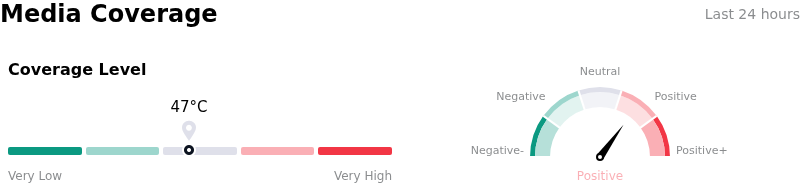
In terms of media coverage, Caterpillar Inc (CAT) shows a coverage score of 47, indicating a moderate level of media attention. The overall market sentiment index is currently in bullish zone.
Fundamental Analysis of Caterpillar Inc (CAT)
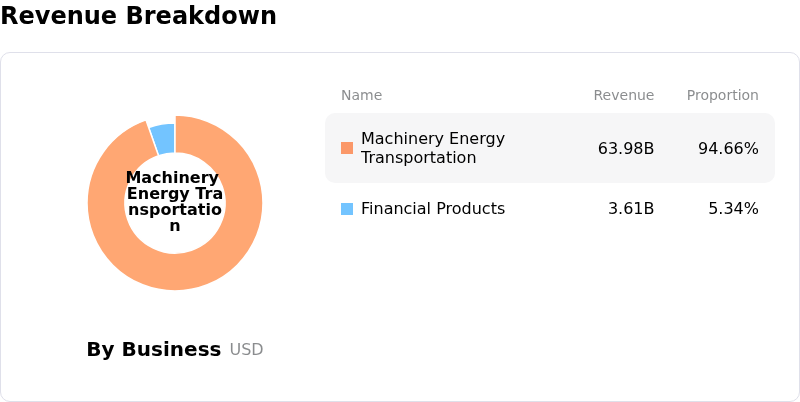
Caterpillar Inc (CAT) is in the Industrial Goods industry. Its latest annual revenue is $67.59B, ranking 1 in the industry. The net profit is $8.88B, ranking 1 in the industry. Company Profile
Over the past month, multiple analysts have rated the company as Buy, with an average price target of $958.10, a high of $1225.00, and a low of $575.00.
More details about Caterpillar Inc (CAT)
Company Specific Risks:
- Data Center Regulatory Restrictions: Escalating state and local regulatory hurdles on data center construction—including state moratoriums and restrictive local legislation—threaten to delay hyperscaler capital spending, dampening forward order momentum for Caterpillar's power generation segment.
- Elevated Valuation Multiple Vulnerability: Trading at an expanded price-to-earnings multiple near 37x relative to its historical low-20s average, the stock faces heightened downside volatility and multiple compression if record backlog conversion or AI infrastructure demand decelerates.
- Tariff Exposure and Margin Pressures: Persistent global trade friction and potential tariff cost burdens, estimated at up to $2.2 billion annually, create execution risk for operating margins if price realization fails to fully absorb input cost inflation.
- Regional Growth Deceleration and Inventory Risks: Subdued revenue growth in key international regions such as Asia-Pacific, combined with the potential for dealer inventory and rental fleet unwinding if cyclical end-user demand softens, poses operational drag against production expansion.
Recommended Articles


