


Dollar Index hits an 18-month high on French debt fears
- DXY tops 102.50, its highest since April 2025, as French bonds slide.
- The Euro, 57.6% of the index, falls to its lowest since May 2025.
- The US ISM services index eases to 54.9, just under the 55 forecast.
France's government owes close to 120% of what its economy produces in a year. The gap between what France and Germany pay to borrow for 10 years reached about 1.5 percentage points on Friday, the widest since 2011. European Central Bank (ECB) President Lagarde had told a French newspaper two days earlier that this isn't 2011.
The Euro makes up 57.6% of the Dollar Index, and its fall to the lowest since May 2025 accounted for about three-quarters of the index's climb to Monday's high.
The Institute for Supply Management (ISM) services index came in at 54.9 against a 55 forecast. Most of the index's slide after the release came from the Euro rising back above 1.1200, not from lower US yields, which edged higher.
On the charts
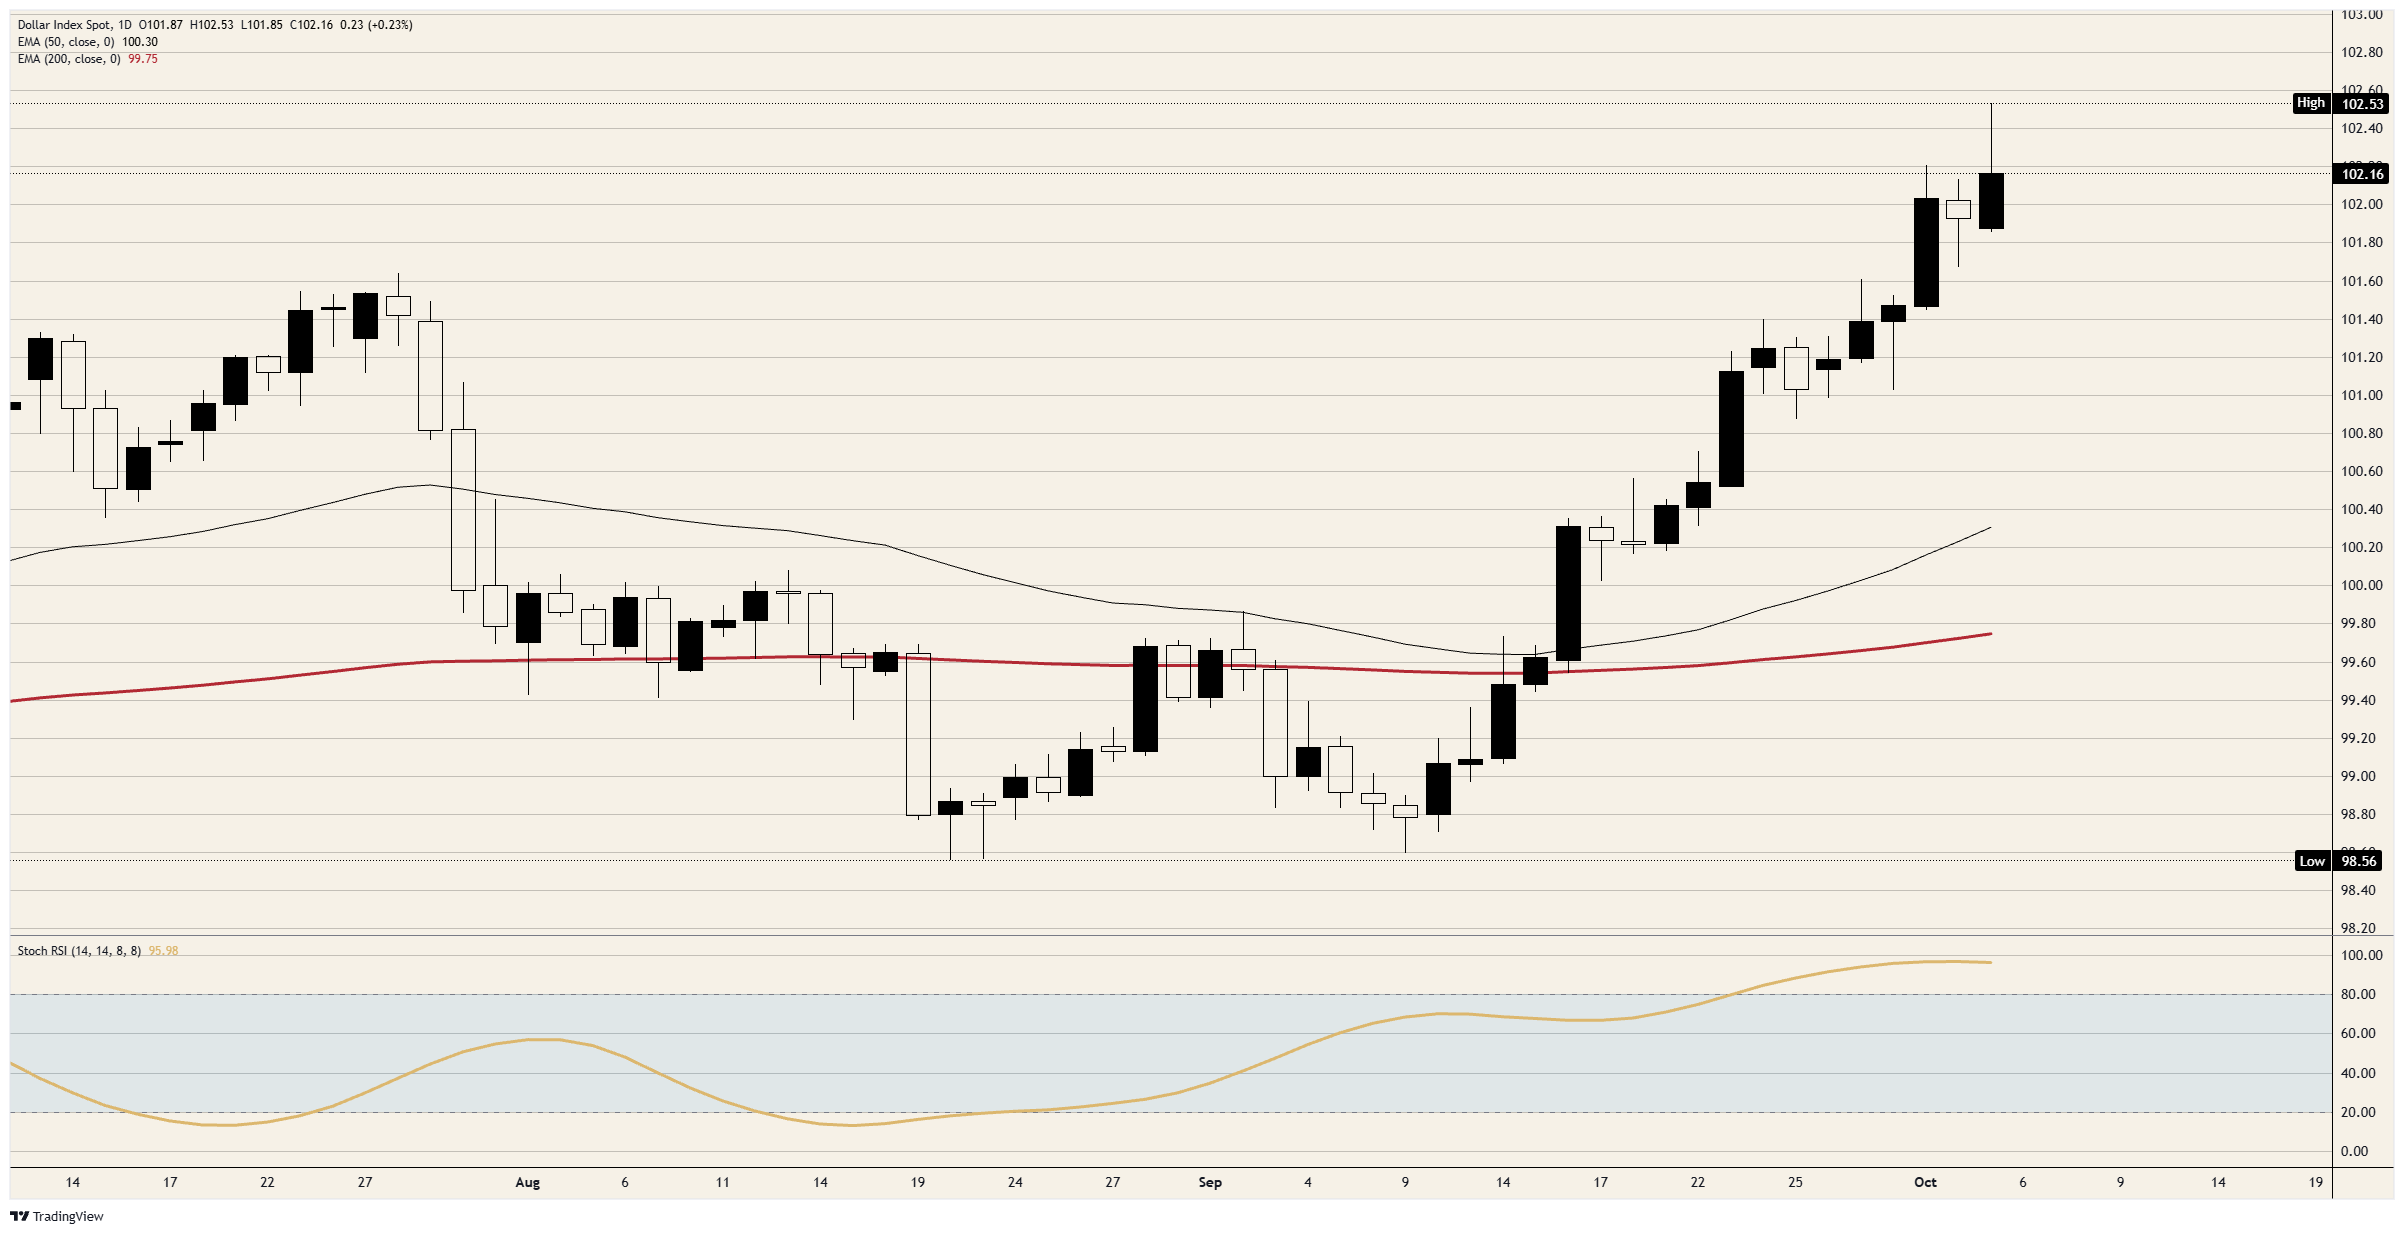
Monday's rise came mostly in two bursts, through the October 1 high near 102.20 to a peak just above 102.50. The index has since given back about half of that gain in two drops, and both have held above 102.00. The rebound between the drops stalled short of 102.40, and the ISM release near that high produced a dip that was gone within four bars.
The pullback from the peak is less than a tenth of the run from the September 9 low near 98.60, after three straight weekly gains. Momentum gauges remained pinned near maximum readings since late September.
DXY daily chart
US Dollar FAQs
The US Dollar (USD) is the official currency of the United States of America, and the ‘de facto’ currency of a significant number of other countries where it is found in circulation alongside local notes. It is the most heavily traded currency in the world, accounting for over 88% of all global foreign exchange turnover, or an average of $6.6 trillion in transactions per day, according to data from 2022. Following the second world war, the USD took over from the British Pound as the world’s reserve currency. For most of its history, the US Dollar was backed by Gold, until the Bretton Woods Agreement in 1971 when the Gold Standard went away.
The most important single factor impacting on the value of the US Dollar is monetary policy, which is shaped by the Federal Reserve (Fed). The Fed has two mandates: to achieve price stability (control inflation) and foster full employment. Its primary tool to achieve these two goals is by adjusting interest rates. When prices are rising too quickly and inflation is above the Fed’s 2% target, the Fed will raise rates, which helps the USD value. When inflation falls below 2% or the Unemployment Rate is too high, the Fed may lower interest rates, which weighs on the Greenback.
In extreme situations, the Federal Reserve can also print more Dollars and enact quantitative easing (QE). QE is the process by which the Fed substantially increases the flow of credit in a stuck financial system. It is a non-standard policy measure used when credit has dried up because banks will not lend to each other (out of the fear of counterparty default). It is a last resort when simply lowering interest rates is unlikely to achieve the necessary result. It was the Fed’s weapon of choice to combat the credit crunch that occurred during the Great Financial Crisis in 2008. It involves the Fed printing more Dollars and using them to buy US government bonds predominantly from financial institutions. QE usually leads to a weaker US Dollar.
Quantitative tightening (QT) is the reverse process whereby the Federal Reserve stops buying bonds from financial institutions and does not reinvest the principal from the bonds it holds maturing in new purchases. It is usually positive for the US Dollar.
Recommended Articles


