


Bitcoin Price Prediction: Bitcoin Breaks $80,000, Can It Return to $100,000?
TradingKey - As of the Asian trading session on August 25, Bitcoin (BTC) prices briefly breached the $80,000 mark intraday, reaching a daily high of $81,272.62 and setting a new near-three-month high. Recently, a continuously weakening US dollar, ongoing Bitcoin ETF capital inflows, and an easing US crypto regulatory environment have supported Bitcoin prices to move steadily higher. Since August, Bitcoin has accumulated a gain of over 28%, rebounding sharply from its mid-August low near $64,000, with short-term market bullish sentiment showing significant improvement.
Bitcoin Reclaims $80,000 as Dollar Weakens and ETF Inflows Return
From a fundamental perspective, the main drivers supporting the sustained rise in Bitcoin prices recently are the depreciation of the US dollar, ETF capital inflows, and favorable regulatory policies.
US Treasury Secretary Bessent recently took measures to stabilize the long-term Treasury market, including expanding buybacks of long-term US Treasuries. The market believes that US policymakers' tolerance for continuously rising long-end Treasury yields is declining. Meanwhile, mounting market concerns over the US fiscal deficit, government debt, and the long-term purchasing power of the US dollar have caused the greenback to weaken continuously, prompting some investors to increase their allocations to alternative assets such as gold and Bitcoin.
In terms of capital flows, data from Farside Investors shows that US spot Bitcoin ETFs saw net inflows of $338 million on August 24, with US spot Bitcoin ETFs attracting a cumulative total of approximately $1.9 billion last week, marking the best-performing week since October 2025. The resumption of continuous ETF inflows signals a significant improvement in institutional investor demand, standing in sharp contrast to the previous state of recurring ETF outflows when BTC traded in a range near $60,000 to $65,000.
Meanwhile, favorable regulatory developments have further reinforced Bitcoin's upward momentum. Trump recently urged the US Congress again to push forward the CLARITY Act to establish a clearer regulatory framework for digital assets. Reduced regulatory uncertainty helps banks, asset managers, and other traditional financial institutions further enter the crypto asset market, thereby supporting Bitcoin prices.
Bitcoin Price Technical Analysis:
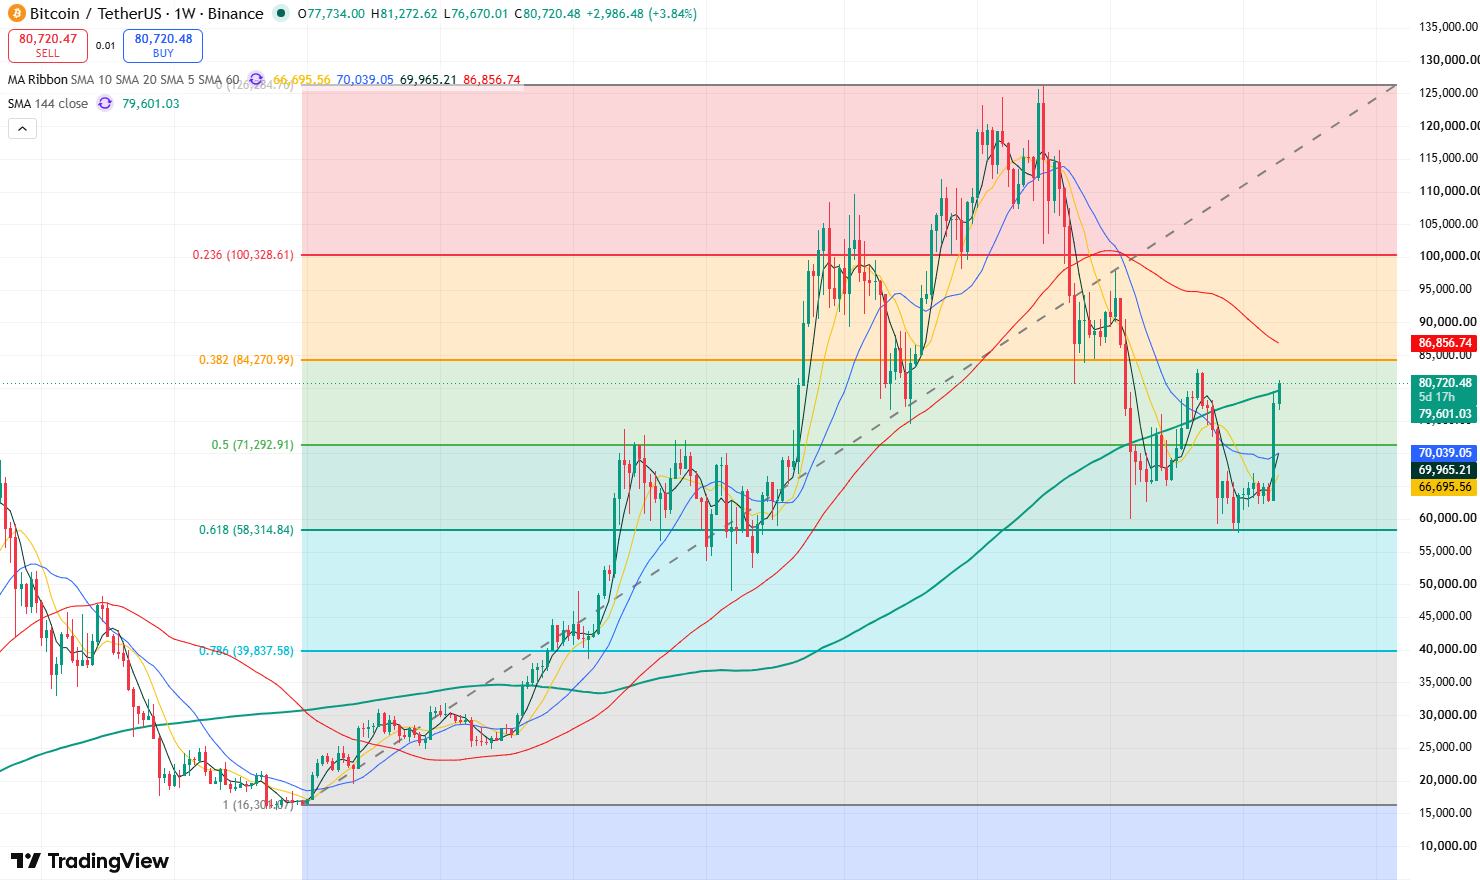
Bitcoin price weekly chart, Source: TradingView
Looking at Bitcoin's weekly chart, Bitcoin had previously consolidated in the $60,000–$65,000 range for a long period. However, since mid-August, it has consecutively broken through $65,000, $70,000, and $75,000, and has now further surpassed $80,000. This indicates that the months-long weak structure is being significantly repaired, and market bullish sentiment has improved noticeably.
Currently, the primary overhead resistance level for Bitcoin to watch is the $83,000–$86,500 range, which is also located near the SMA 60 line. If it can effectively break through and hold firmly above $86,500, Bitcoin's year-to-date downtrend may be reversed, opening up upside room toward the $90,000 mark. If it breaks above this level, Bitcoin will test the January rebound high of $97,924, and may even further test the $100,000 mark.
On the downside, if Bitcoin weakens under short-term pressure below $83,000, the primary target for a pullback is $79,500. If this level fails to hold, it may fall back further toward $75,000. If it declines again, it may test support at the SMA 10 line.
Recommended Articles


