


Solana (SOL) Five-Year Price Forecast: Can It Reach $1,000 by 2030?
How Has Solana's Price Trended Over the Past Five Years?
TradingKey - Solana (SOL)'s price history over the past five years is one of the most dramatic and resilient cases in the cryptocurrency market. As a "Layer 1 public blockchain" featuring high throughput and low transaction fees, SOL evolved from an early token worth a few dollars through four key stages: a stunning bull market explosion, a devastating liquidation brought on by the FTX collapse, a strong rebound after an ecosystem recovery, and currently entering a new round of bubble deflating.
In March 2020, the Solana mainnet went live, with its price at only around $0.50. Entering 2021, SOL's price climbed to around $3 and then rapidly surged to $259.96 in November, setting a then-all-time high. In 2022, the crypto market entered a bear market, and SOL's price drifted steadily lower until bottoming out at $8 in 2023 before rebounding.
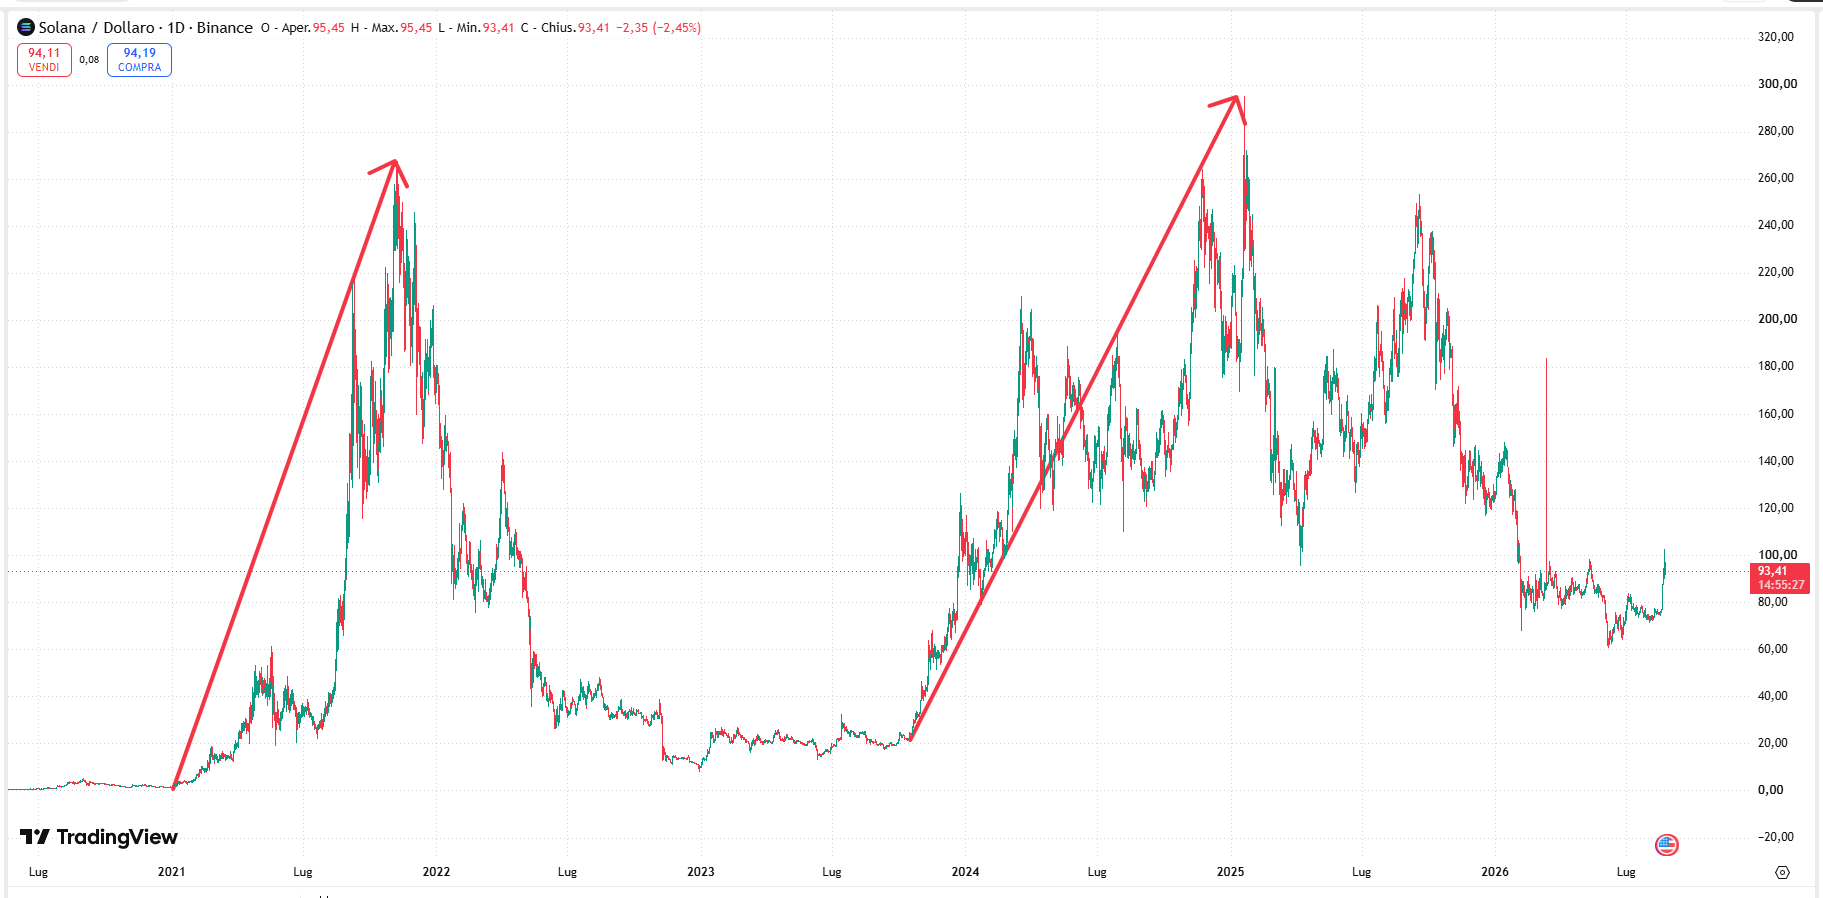 Solana price chart, Source: TradingView
From 2023 to late 2024, Solana's price experienced a recovery, rebounding strongly from $10 to reclaim the $100–$200 range. In January 2025, SOL's price surged close to $300, setting a new record high before initiating a new round of sharp sell-offs. Prior to this, SOL's price rebound failed to challenge its all-time high, coming under pressure and trending downward after rising to around $250, falling to near $60 on June 1 this year—marking the lowest point of this bear market so far—and is currently hovering around $100.
What Factors Drive Solana Price Changes?
Solana has experienced one of the most dramatic "roller-coaster" trends in cryptocurrency history over the past five years, with its price fluctuations resembling Ethereum (ETH), driven primarily by key factors such as macro liquidity, ecosystem technological breakthroughs, and explosive application adoption.
Time Period | Reasons for Rally / Decline |
2021 | - Global central bank easing policies brought massive liquidity; - Attracted a large number of DeFi and NFT projects with high TPS and extremely low transaction fees; - Strong endorsements from FTX founder SBF and top VC capital drove prices up. |
2022 | - The Federal Reserve launched an aggressive rate-hiking cycle; - FTX exchange and Alameda, its largest backer and market maker, went bankrupt. |
2024-2025 | - Platforms like Pump.fun drove a Meme coin frenzy, with DEX trading volume and on-chain activity continuing to hit new highs; - Real-world asset (RWA) tokenization and spot ETF expectations drove institutional capital inflows. |
2026 | - Major central banks maintained relatively tight monetary policies, putting overall liquidity in high-risk asset markets under pressure and driving capital from high-risk cryptocurrencies into safe-haven assets. - The Meme coin craze cooled down, leading to corresponding declines in on-chain trading volume, DEX transaction volume, and network fee revenue. |
Will Solana Prices Fall Further This Year?
In the short term, Solana still faces the possibility of further downside, mainly due to significant uncertainty surrounding macro liquidity. Furthermore, not only does it lack bullish support (its biggest positive catalyst, a burn proposal, may fail due to insufficient voter turnout), but it also faces bearish pressure.
Previously, Solana's price explosion relied heavily on meme coin issuance and high-frequency trading driven by platforms such as Pump.fun. Now, with speculative capital exiting and on-chain fee revenues as well as decentralized exchange trading volumes declining significantly, fundamental support will face a valuation adjustment.
The on-chain SOL staking unlock mechanism allows tokens held by early institutions, validators, and the team to regularly enter secondary market circulation, with Alameda Research/FTX bankruptcy wallets continually selling in particular. In the absence of sufficient incoming buying demand to absorb the supply, ongoing inflationary token issuance and unlock selling pressure will cap prices over the long term.
Although the U.S. Treasury's bond buyback program is expected to boost global liquidity and helped spot Solana ETFs attract capital inflows this week, the Federal Reserve's current policy tone remains neutral-to-hawkish, meaning corrective pressure on global risk assets (including cryptocurrencies) has not yet been lifted.
Solana Price Prediction: Expected to Reach $1,000 in Next Five Years
Although Solana could retest the $60 low due to the macroeconomic environment, reaching $1,000 over the next five years is a possible extreme scenario in theoretical and institutional models. However, it requires meeting certain market conditions: technological breakthroughs in Solana driving adoption, such as completely resolving past network congestion and outage risks, pushing throughput to the million-TPS level, and attracting traditional financial institutions like Visa and Stripe to migrate settlement to Solana.
Another factor is causing SOL's inflation rate to drop by 15% annually, eventually stabilizing at 1.5%, which would significantly ease supply-side pressure over time. Currently, this plan is advancing; the recently voted SGP-0002 proposal addresses this issue, planning to double the pace of SOL's annual inflation decline and bring the target minimum inflation rate of 1.5% forward to 2029.
So, what does $1,000 actually mean? If SOL's unit price reaches $1,000, based on the current circulating supply of roughly 470 million to 500 million tokens, its fully diluted valuation (FDV) would reach $500 billion to $600 billion, meaning SOL's market cap would need to approach ETH's peak level. Some Wall Street institutions believe Solana could reach this level, with Standard Chartered and VanEck forecasting SOL to rise to around $2,000 and $3,000, respectively, over the next five years.
Conclusion
Over the past five years, Solana has experienced two cycles of wild rallies and steep crashes, surging from a few dollars to a record high of nearly $300 before undergoing a sharp correction. Its trajectory has been influenced by macro liquidity, the collapse of FTX, the meme coin frenzy, and selling pressure from on-chain unlocks. Over the next five years, if Solana can achieve technological breakthroughs and drive token deflation, institutions are bullish on the potential of its token SOL to hit $1,000.
Recommended Articles


