

XRP Price Prediction: XRP Pulls Back After $1.7 Push Stalls, Is the Rally Over?

Source Tradingkey

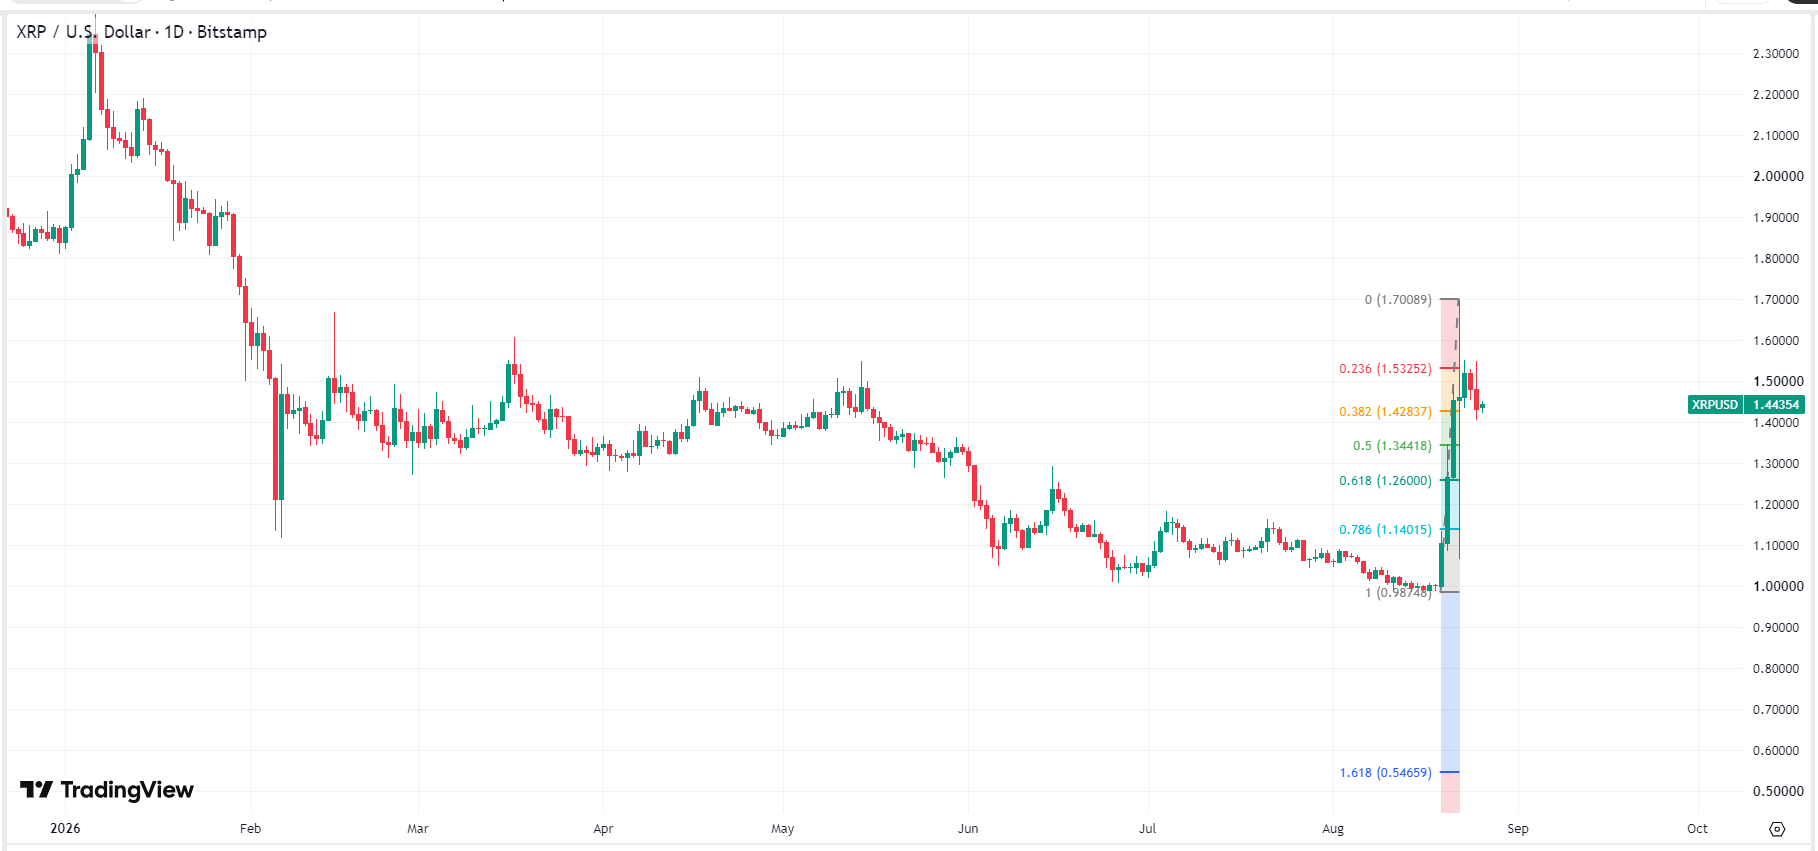
TradingKey - On August 26, Ripple (XRP) price fluctuated lower, falling over 4% today and dropping below $1.5. Since August 19, XRP price had been continuously rising, surging past $1.7 on August 22, up 70% in less than four days. However, after hitting strong resistance at $1.7 and pulling back, does this mean the rebound rally is completely over?

Is the XRP Price Rebound Over?

Recently, U.S. Treasury Department intervention in the Treasury market raised concerns over U.S. debt deficit monetization and U.S. dollar depreciation. Meanwhile, the Senate's push for the Digital Asset Market Clarity Act and the SEC's release of new cryptocurrency rules resonated to drive a rally in Bitcoin and the broader crypto market. However, Bitcoin pulled back after briefly breaching the key $80,000 mark, dragging XRP down with it, which was the core reason for its decline.

In addition, Bitcoin's high dominance drained most market liquidity, making it difficult for altcoins to sustain continuous, one-sided surges. Moreover, XRPL's daily on-chain transaction volume and network base fee burns failed to show synchronized explosive growth. Under these circumstances, as XRP surged into the $1.50–$1.70 range—a zone of previous multiple peaks and concentrated volume—earlier trapped positions and short-term profit-taking capital chose to exit, generating strong selling pressure.

However, looking at current market dynamics and technicals, XRP's rebound is "not yet completely over," but it has entered a phase of short-term high-level volatility and consolidation. Currently, Bitcoin (BTC) and Ethereum (ETH) maintaining relatively high levels provides overall liquidity support for altcoin rebounds. Furthermore, with the Federal Reserve's interest rate decision and the key vote on the Clarity Act coming in mid-September, the preceding window period is highly likely to sustain the current upward trend.

Where Is XRP Price Headed Next?

The XRP price pullback was not due to a deterioration in its own fundamentals, but was primarily driven by following the broader market correction and profit-taking. Therefore, as long as Bitcoin remains at high levels above $80,000, XRP's price is expected to rise and strengthen again toward $1.7. However, to test this level, Bitcoin will likely need to break through its May high of $83,000 to trigger market FOMO once more.
xrp-ripple-price-caa7920913ec4107ae42a217ae972cefXRP price chart, Source: TradingView

However, if Bitcoin's price falls below its recent pullback low of $75,000, it will signal to the market whether the rebound has ended, dragging XRP down below its Fibonacci 0.382 retracement support level at around $1.4, with a potential further decline toward $1.3. Of course, if the macroeconomic environment deteriorates, such as the Federal Reserve raising interest rates or the Clarity Act being rejected, there is a high probability that XRP will retest $1.

Disclaimer: For information purposes only. Past performance is not indicative of future results.
placeholder
XRP Price Prediction for July 2026: Can Buyers Finally Break the Downtrend?XRP (XRP) price trades near $1.05, caught between a year-long downtrend and a sudden burst of buying.July has historically rewarded XRP holders. This year the month arrives with on-chain accumulation
Author  Beincrypto
Jun 30, Tue
XRP (XRP) price trades near $1.05, caught between a year-long downtrend and a sudden burst of buying.July has historically rewarded XRP holders. This year the month arrives with on-chain accumulation
placeholder
XAUUSD Gold Analysis: Gold Holds Above $4,350 Ahead of US Inflation Data Is $4,500 Next? Gold holds above $4,350 following weak US jobs data. As inflation reports approach and UBS eyes $5,000, can XAUUSD break resistance at $4,435 to rally toward $4,500?
Author  Naoufal Seddik
Aug 12, Wed
Gold holds above $4,350 following weak US jobs data. As inflation reports approach and UBS eyes $5,000, can XAUUSD break resistance at $4,435 to rally toward $4,500?
placeholder
Gold Price Analysis Today: Gold Drops 1.32% Despite Lower Fed Rate-Hike Bets, Can $4,313 Support Hold? Gold fell 1.32% on August 13 after rising to $4,449.73, then reversing lower and closing near $4,349.918 below the $4,356.46 support. Softer US inflation data reduced Fed rate hike expectations, but selling pressure still dominated the session. Will $4,313 support hold?
Author  Naoufal Seddik
Aug 14, Fri
Gold fell 1.32% on August 13 after rising to $4,449.73, then reversing lower and closing near $4,349.918 below the $4,356.46 support. Softer US inflation data reduced Fed rate hike expectations, but selling pressure still dominated the session. Will $4,313 support hold?
placeholder
Gold Price Analysis Today: Gold Gains 0.94% as Markets Expect Fed to Hold Rates, Can $4,449 Resistance Break? Gold gained 0.94% on August 17, closing near $4,417.30 as softer US data strengthened expectations for unchanged Fed rates in September. Gold remains bullish, with $4,449.730 resistance and $4,310.650 support in focus.
Author  Naoufal Seddik
Aug 18, Tue
Gold gained 0.94% on August 17, closing near $4,417.30 as softer US data strengthened expectations for unchanged Fed rates in September. Gold remains bullish, with $4,449.730 resistance and $4,310.650 support in focus.
placeholder
Gold Price Analysis Today: Gold Rebounds After 1.91% Drop as Yields Ease. Is $4,449 Next? Gold fell about 1.91% on August 18 before producing a strong bullish reaction from the 1-hour demand zone in early August 19 trading. RSI is recovering from oversold conditions, but Supertrend remains bearish as traders await the Fed minutes.
Author  Naoufal Seddik
Aug 19, Wed
Gold fell about 1.91% on August 18 before producing a strong bullish reaction from the 1-hour demand zone in early August 19 trading. RSI is recovering from oversold conditions, but Supertrend remains bearish as traders await the Fed minutes.
goTop
quote