


EUR/USD Price Forecast: Remains sideways ahead of key US events
- EUR/USD remains in a limited range near 1.1660 in the countdown to the US PCE Inflation data.
- Investors keenly await the outcome of the Jackson Hole Symposium.
- The ECB is expected to raise interest rates in the September policy meeting.
The Euro (EUR) continues to trade in a tight range at around 1.1660 against the US Dollar (USD) during the Asian trading session on Wednesday. The pair struggles for direction as investors have sidelined, awaiting the United States (US) Personal Consumption Expenditure Price Index (PCE) data for July, which will be published at 12:30 GMT.
Inflation seen easing only gradually as core pressures remain firm
Wells Fargo is “not expecting much surprise on inflation,” noting that “the latest CPI and PPI reports point to a 0.1% gain in the PCE deflator in July, nudging the year-over-year rate down to 3.6%.” The bank expects “core PCE inflation” to “rise 0.2% on the month, leaving the annual rate at 3.3%,” underscoring a picture of gradual disinflation but inflation still running above the Fed’s target.
This week, the key event for the major currency pair will be remarks from Federal Reserve (Fed) Chair Kevin Warsh at the Jackson Hole Symposium, which will begin early Thursday.
On the Euro front, market participants seem confident that the European Central Bank (ECB) will raise interest rates in the September policy meeting.
Euro area resilience keeps ECB on track for one last hike
Analysts at Deutsche Bank argue that, in the absence of “clear evidence of broad-based second-round effects,” the case for pushing policy beyond the “2.50% neutral upper bound is unlikely.” Against that backdrop, and despite the recent energy-driven uptick in Euro area inflation, they “continue to expect a final 25bps ECB hike in September to a 2.50% terminal rate,” marking what they see as the end of the current tightening cycle.
EUR/USD Technical Analysis
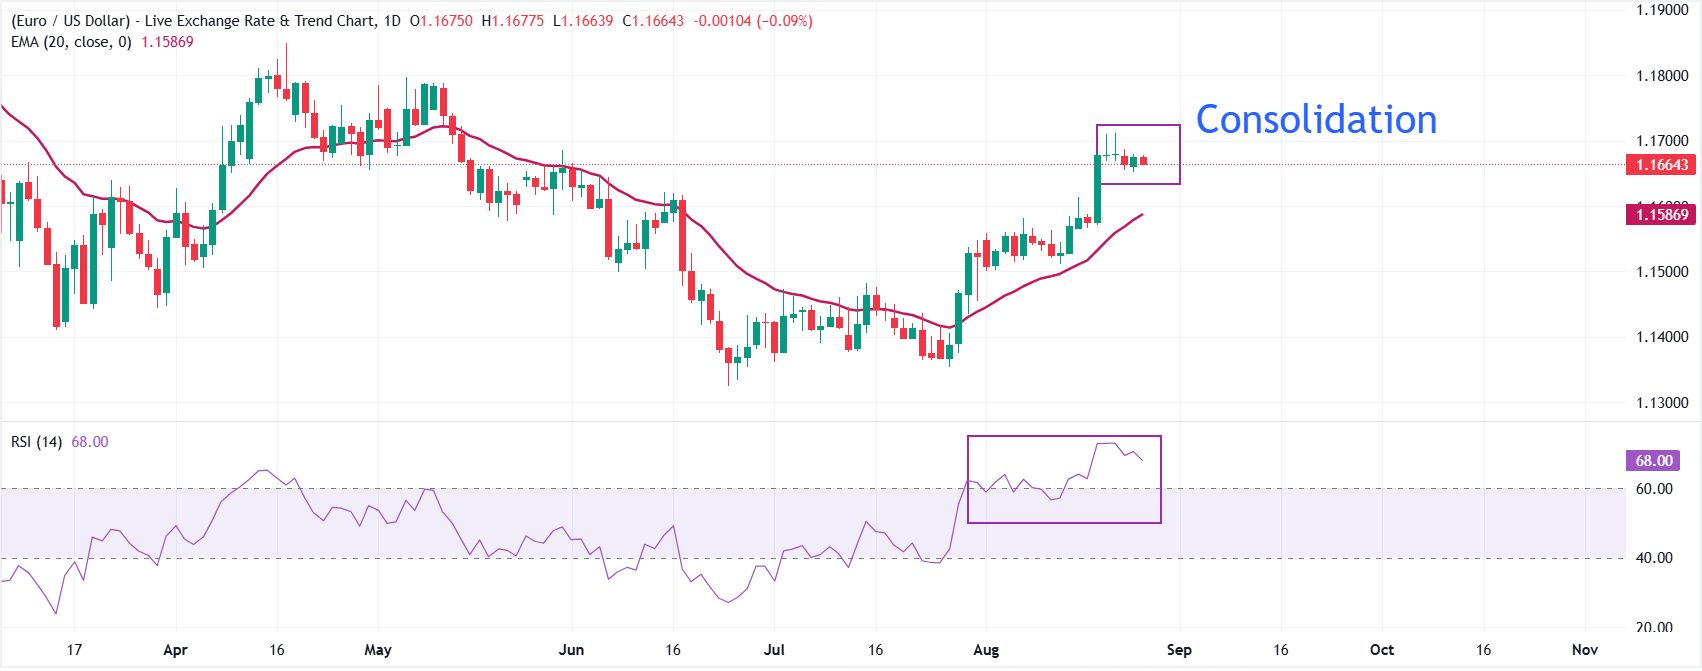
In the daily chart, EUR/USD trades at 1.1664. The pair holds above the 20-period Exponential Moving Average (EMA) at 1.1587, keeping the near-term tone bullish as price clings to the day’s open pivot at 1.1664. Momentum remains firm, with the 14-period Relative Strength Index (RSI) hovering near 68, hinting at strong buying pressure but also a market that is edging toward overbought territory.
On the downside, immediate support emerges at the day’s open and current pivot near 1.1664, while the 20-period EMA at 1.1587 forms a secondary demand zone below. Looking up, the major currency pair needs to break above the August 21 high at 1.1711 to extend the rally towards the May high near 1.1800.
Strategists at Scotiabank also see limited hurdles before 1.1800. They said in a note that remain constructive on EUR/USD, noting that the “RSI remains bullish around the overbought threshold at 70,” underscoring the strength of recent gains. They judge that “the latest rally looks to have stalled above near-term resistance around 1.17,” but highlight “the absence of any additional meaningful resistance ahead of 1.18,” suggesting the upside remains relatively unobstructed in the short term. On the downside, Scotiabank identifies “near-term support at 1.1650 and 1.1600,” and draws attention to the “200 day MA at 1.1632” as an additional technical reference point for traders.
(The technical analysis of this story was written with the help of an AI tool. Know more.)
Economic Indicator
Core Personal Consumption Expenditures - Price Index (YoY)
The Core Personal Consumption Expenditures (PCE), released by the US Bureau of Economic Analysis on a monthly basis, measures the changes in the prices of goods and services purchased by consumers in the United States (US). The PCE Price Index is also the Federal Reserve’s (Fed) preferred gauge of inflation. The YoY reading compares the prices of goods in the reference month to the same month a year earlier. The core reading excludes the so-called more volatile food and energy components to give a more accurate measurement of price pressures." Generally, a high reading is bullish for the US Dollar (USD), while a low reading is bearish.
Read more.Next release: Wed Aug 26, 2026 12:30
Frequency: Monthly
Consensus: 3.3%
Previous: 3.3%
Source: US Bureau of Economic Analysis
After publishing the GDP report, the US Bureau of Economic Analysis releases the Personal Consumption Expenditures (PCE) Price Index data alongside the monthly changes in Personal Spending and Personal Income. FOMC policymakers use the annual Core PCE Price Index, which excludes volatile food and energy prices, as their primary gauge of inflation. A stronger-than-expected reading could help the USD outperform its rivals as it would hint at a possible hawkish shift in the Fed’s forward guidance and vice versa.
Recommended Articles


