


WTI Crude Oil Price Forecast: Oil Plunges Nearly 5% as US-Iran Talks Expected to Resume, Will It Fall Further?
TradingKey - As of the Asian session on August 26, WTI crude oil (USOIL) prices extended yesterday's decline, dropping to an intraday low of $80.26 and approaching the $80 threshold at one point, down nearly 1% on the day. Previously, WTI crude tumbled 4.58% on Tuesday to close at $81.10, marking its lowest closing level since August 13. The recent rapid pullback in oil prices from above $85 is primarily driven by renewed market bets on a diplomatic easing of U.S.-Iran tensions, which has heightened expectations for the resumption of more crude shipments through the Strait of Hormuz.
New Progress in US-Iran Diplomacy and Strait of Hormuz Reopening Expectations Weigh on Oil Prices
From a fundamental perspective, the core factors influencing oil price trends recently remain the US-Iran situation and when the Strait of Hormuz will resume normal navigation.
The latest news shows that Iran has restarted negotiations with Oman on the management of the Strait of Hormuz. Against the backdrop of the US further expanding economic sanctions against Iran, the market believes Tehran faces greater economic pressure, and the likelihood of restoring navigation through the strait via diplomatic means is rising. Before the outbreak of the war this year, the Strait of Hormuz carried about one-fifth of global oil and LNG transport; therefore, any signs of resuming normal navigation imply that the supply risk premium previously priced into oil prices may decline further.
Trump's latest statement has also reinforced this expectation. On August 25, Trump stated that all sea mines in the international waters of the Strait of Hormuz have been detonated or cleared, while warning Iran against laying mines again. Although a clear military confrontation between the US and Iran remains, the two sides have not directly conducted airstrikes on each other's military targets for several weeks.
However, the strait is actually still far from resuming normal transport. Vortexa data shows that oil shipments through the Strait of Hormuz on Monday were about 5 million barrels per day, compared to more than 20 million barrels per day before the war. If negotiations between Iran and Oman make substantive progress and more tankers re-enter the Strait of Hormuz, the risk premium previously created by geopolitical conflicts may continue to fade, leaving room for WTI to fall further; however, if negotiations collapse again, or if new events such as tanker attacks or mine-laying occur in the strait, oil prices could also rebound rapidly.
On the other hand, the recovery of OPEC supply is increasing downward pressure on oil prices. OPEC crude oil output in July increased by about 1.17 million barrels per day month-on-month to 19.85 million barrels per day, primarily driven by supply restoration from oil producers such as Iraq, Kuwait, and Iran. Meanwhile, OPEC+ has decided to further increase production quotas by about 188,000 barrels per day in September, completing the phase-out of the previous 1.65 million barrels per day voluntary production cuts. Rystad Energy believes that as exports gradually recover, the issue facing OPEC+ in the next phase will shift from supply disruptions to managing potential oversupply.
WTI Crude Oil Price Technical Analysis
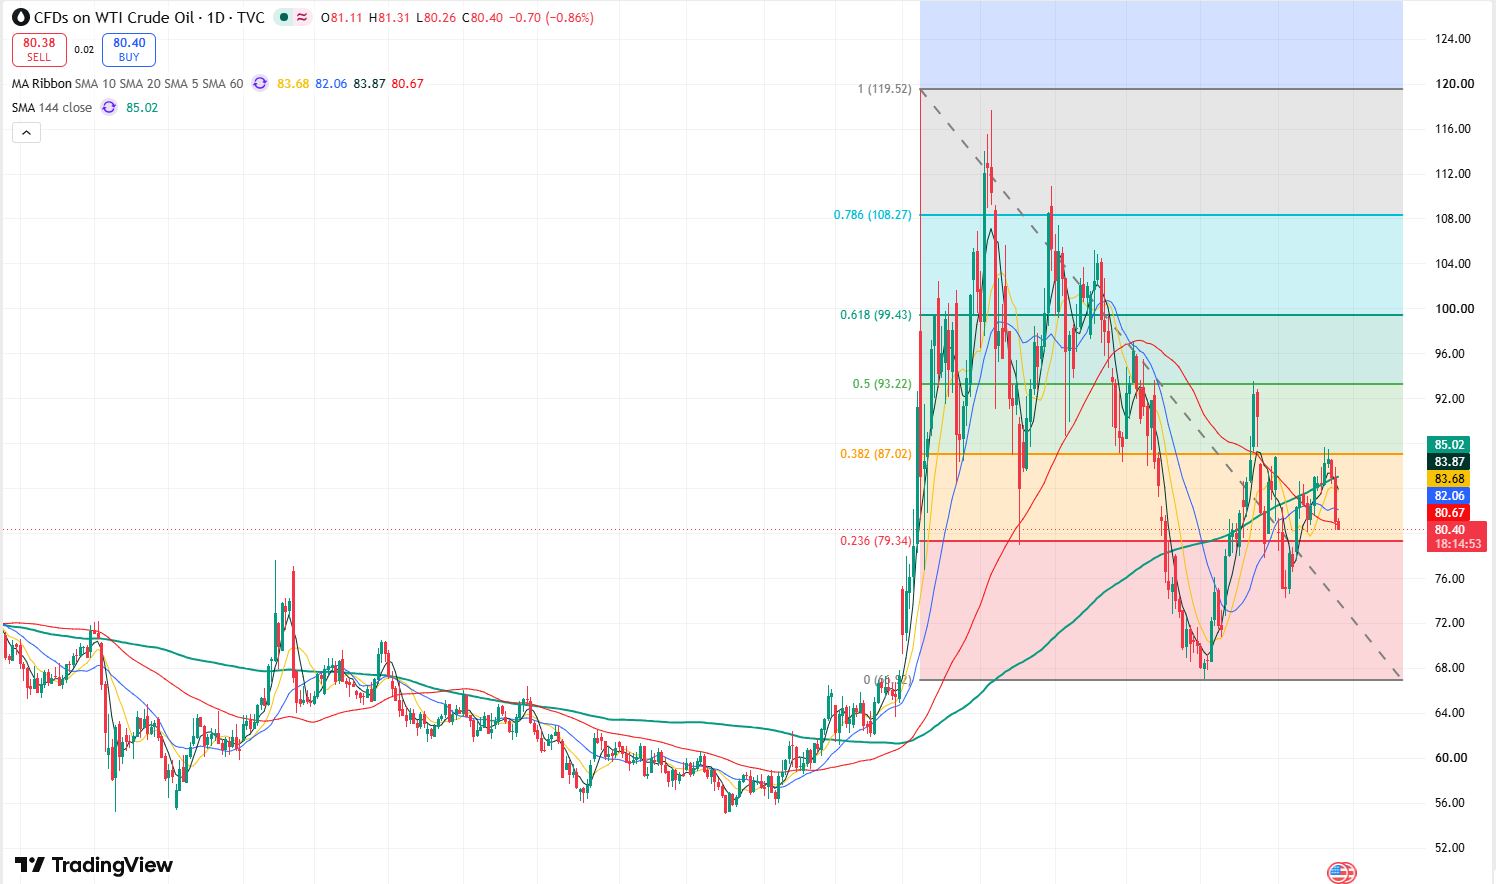
WTI crude oil price daily chart, source: TradingView
Looking at the daily chart of WTI crude oil prices, oil prices previously rebounded rapidly from near $75, once rising above $85, but repeatedly encountered resistance below the $87 resistance level. Entering this week, oil prices broke below the short-term upward structure and plunged over 4% on Tuesday, moving further toward $80 today, indicating that the short-term market has clearly turned bearish.
Currently, the primary downside support level for oil prices is the $80-$79 area. If oil prices fall below $79, they will further test the $75 support level. If this level fails to hold, oil prices may fall toward the $70 mark, or even test the July low of $67.04.
On the upside, the primary resistance level to watch above is $87. If oil prices can break through and hold above this level, they will test the $93 resistance level.
Recommended Articles


