


Cardano Price Forecast: ADA rally pauses as profit taking kicks in
- Cardano price trades slightly lower, hovering around $0.220 on Monday after a massive 29% rally last week.
- On-chain and derivatives data turn slightly bearish as traders appear to take profits following ADA’s sharp gains.
- The technical outlook remains bullish, but momentum indicators suggest the upside is becoming stretched, raising risk of pause or consolidation.
Cardano (ADA) faces a mild pullback, trading below $0.220 on Monday after a skyrocketing 29% rally in the previous week. On-chain and derivatives data turn slightly bearish as traders appear to take profits following ADA’s massive gains. Technically, the outlook remains bullish, but momentum indicators suggest further upside is becoming increasingly stretched, raising the risk of a pause or consolidation ahead.
Cardano traders appear to take profits following sharp gains
Cardano price soared more than 29% last week, supported by crypto markets continuing to cheer the US Treasury’s decision to double its debt buyback operations. Such a massive rally in a short period generally leads to profit-taking, suggesting a pause or consolidation in price action.
Santiment’s Supply Distribution data supports a cautious outlook for Cardano, as large-wallet holders (whales) are reducing exposure.
The metric indicates that whales holding between 1 million and 10 million (yellow line) and 10 million and 100 million tokens (blue line) have shed 100 million tokens since Saturday. This distribution by large holders could signal profit-taking and increase near-term downside risks for Cardano.
 [10-1787546912559.07.03, 24 Aug, 2026].png)
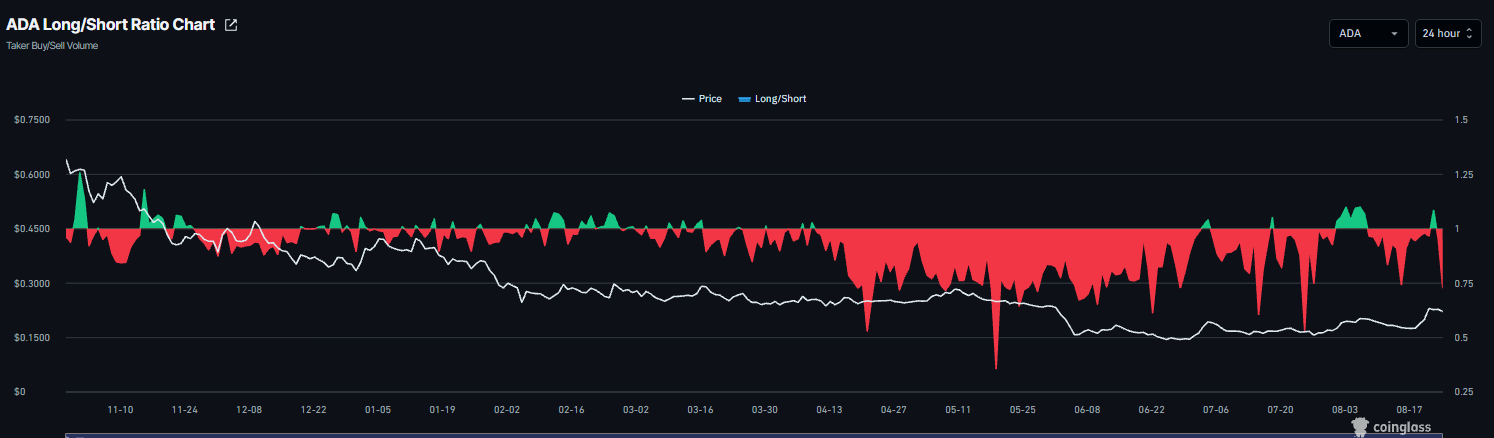
Cardano derivatives metrics also show a cautious outlook. CoinGlass’ long-to-short ratio for ADA reads 0.72 on Monday, nearing the lowest level in over a month. This ratio, being below one, reflects bearish sentiment in the market, as more traders are betting on the asset’s price to fall.
Cardano technical outlook: Faces rejection from the 200-day EMA
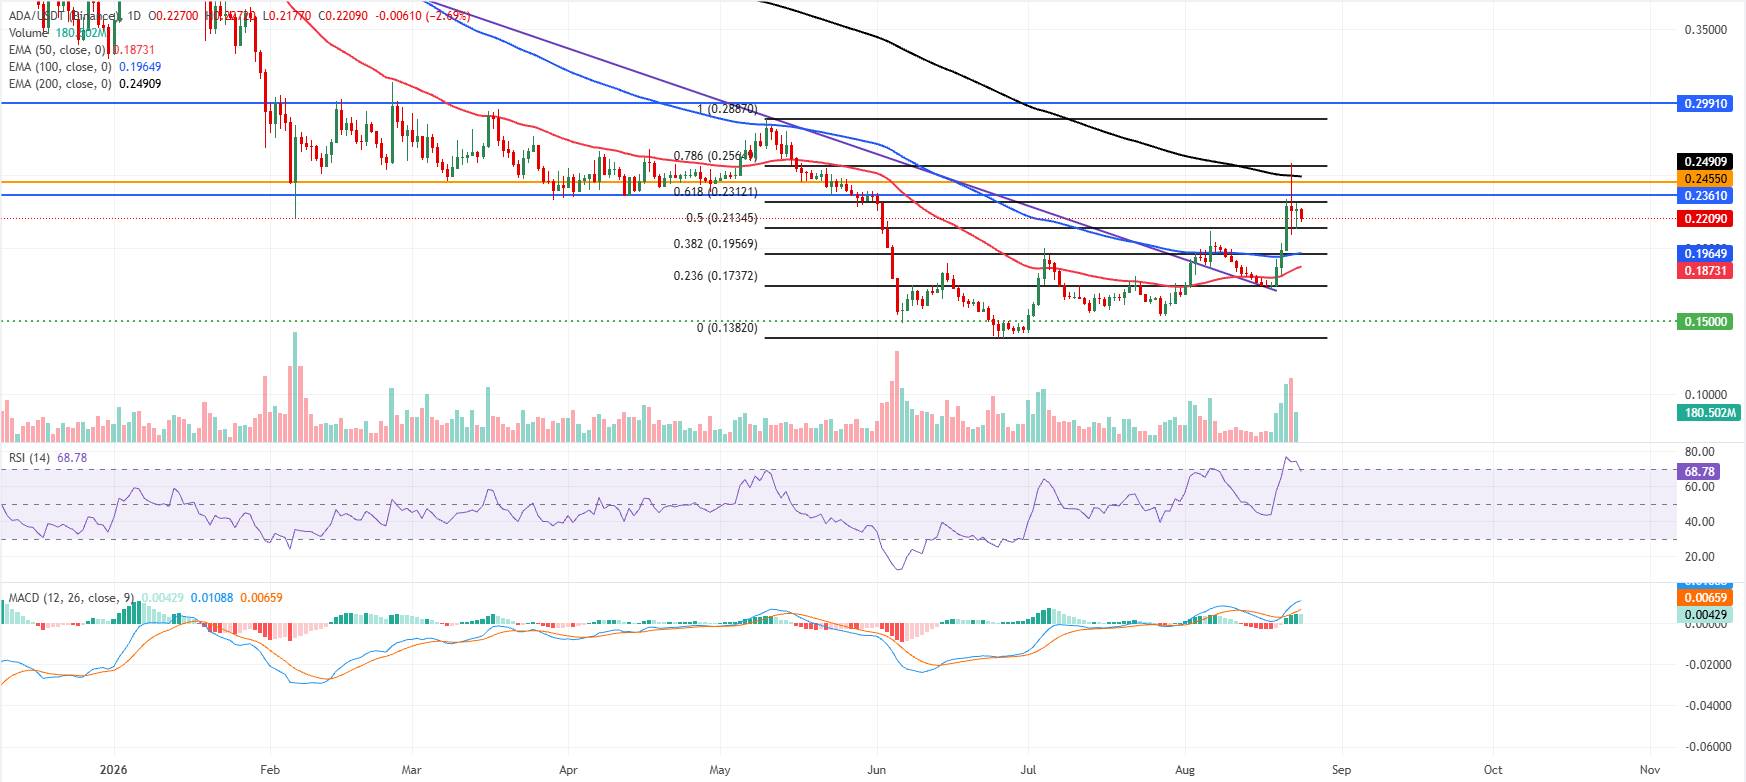
Cardano price trades at $0.220 on Monday, holding a constructive near-term bullish bias as the price stands above the 50-day and 100-day Exponential Moving Averages (EMAs) at $0.187 and $0.196. ADA is advancing after reclaiming the mid-range Fibonacci support at the 50% retracement near $0.213, while the Relative Strength Index (RSI) hovers around 69, hinting at strong but increasingly stretched upside momentum. The Moving Average Convergence Divergence (MACD) is positive and above its signal line, with a modestly expanding histogram that reinforces the current upward pressure. However, overhead levels still cap the broader recovery.
On the topside, initial resistance emerges at the 61.8% Fibonacci retracement at $0.231, followed higher by the horizontal barrier at $0.236 and then $0.245, ahead of the thicker supply zone defined by the 200-day EMA at $0.249; a sustained break above this cluster would open the way toward $0.299.
On the downside, immediate support is seen around the recent breakout area near $0.213, with a secondary demand band in the $0.196 region where the 100-day EMA and the 38.2% retracement near $0.195 converge, before the 50-day EMA at $0.187 and deeper structural floors at $0.173, the trendline break price at $0.164, and the horizontal base at $0.150.
(The technical analysis of this story was written with the help of an AI tool. Know more.)
Recommended Articles


