


Ethereum Price Prediction: ETH Breaks $2,300 in Five-Day Streak; How Long Can the Bull Rally Last?
TradingKey - Ethereum rallies for five consecutive sessions, targeting $2,800 next.
On August 21, Ethereum (ETH) extended its rally, breaking through the $2,300 mark to reach $2,362, hitting its highest level since May this year. Starting from around $1,800 on Monday, this upward move has accumulated a gain of over 30% so far. However, can Ethereum sustain this rapid streak of gains?
This wave of Ethereum's rally has been driven primarily by liquidity injections from the U.S. Treasury Department and further regulatory environment improvements by the SEC, sparking massive capital inflows. Over the past four days, U.S. spot Ethereum ETFs have recorded continuous net inflows that keep growing, totaling over $500 million. Of this, yesterday's net inflow reached nearly $220 million, marking the highest single-day level since September 2025.
The core supporting factor for the continuation of Ethereum's rally is inflows into U.S. spot ETFs and institutional capital, which reflect the U.S. capital market's stance toward ETH. If spot ETH ETFs maintain continuous net inflows, and open interest in the derivatives market rises steadily without blind over-leveraging, market health remains high.
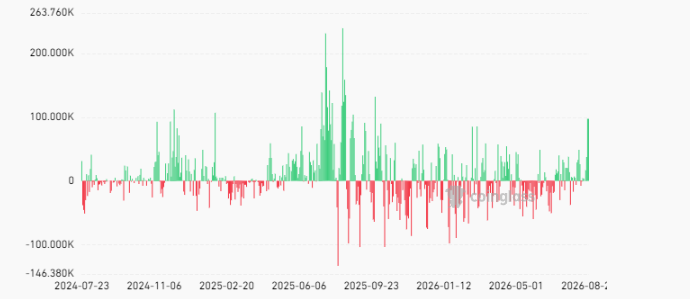 U.S. spot Ethereum ETF capital flows, Source: CoinGlass
However, capital inflows do not happen without reason; they occur only when spurred by positive catalysts, with the macro liquidity environment being the most vital factor. If Federal Reserve rate cut expectations and global liquidity improve, it typically directly enhances the valuation premium of high-risk assets such as crypto assets. Conversely, if liquidity tightens, the rally will be dealt a blow and could even erase recent gains.
Liquidity easing will boost activity across the entire crypto market. Increased on-chain activities, such as total value locked (TVL) in DeFi and Layer 2 as well as Gas consumption, will accelerate the burn rate of ETH, further reducing circulating supply and providing fundamental support for the price. Conversely, if on-chain activity falls into a slump, ETH prices will suffer a double blow. Therefore, the key to whether ETH prices continue to rise lies in U.S. liquidity injection conditions, which currently remain tilted toward easing, providing a fundamental guarantee for ETH.
From a technical perspective, Ethereum's price is approaching the high points of its March and May rebounds this year, both of which failed in the $2,300–$2,400 range—also serving as the first bounce resistance at the 0.236 Fibonacci level. Going forward, if ETH can consolidate above $2,300, it would represent a healthy correction with potential to push further toward $2,800. Conversely, breaking below $2,300 would signal the end of this rally, making a drop back to $1,500 to build a base highly probable.
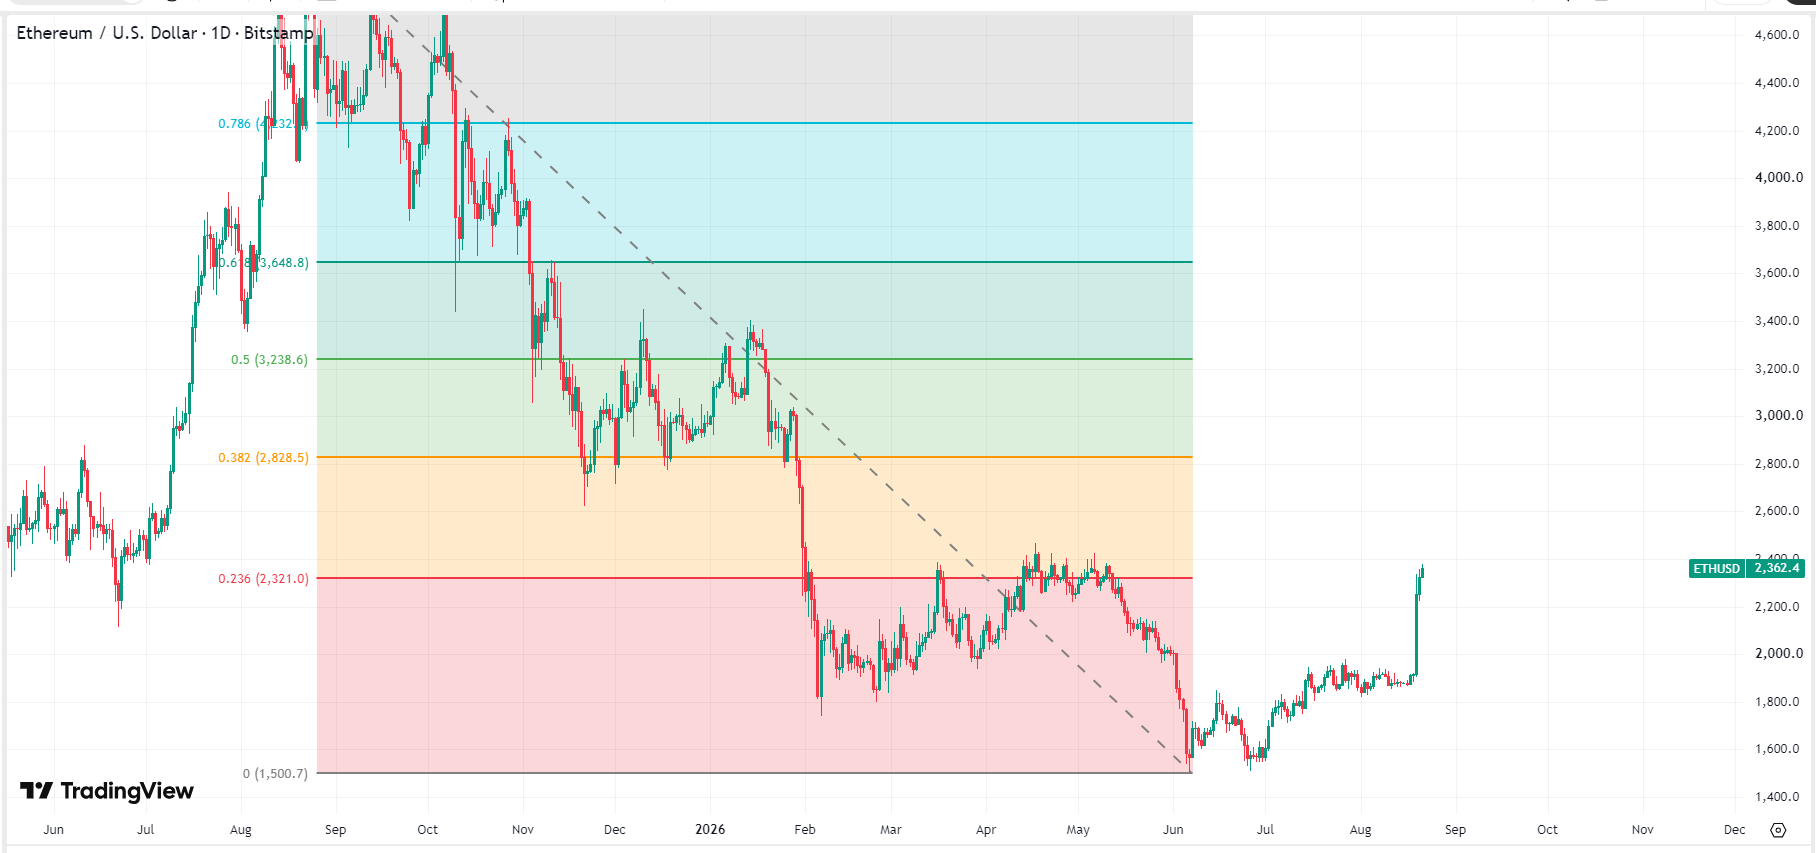 Ethereum price chart, Source: TradingView
Recommended Articles


