

Bitcoin Surges 10% in a Day to Top $77,000, Hitting a Three-Month High

Source Tradingkey

TradingKey - Bitcoin surged 10% to break through the $77,000 mark, hitting a three-month high with potential to extend its gains.

On August 21, Bitcoin (BTC) initiated a new wave of consensus, surging 10% today to break through the key $77,000 mark, trading at $77,124, setting a new three-month high. Over the past five days, Bitcoin prices have continued to soar, accumulating a gain of around 22% so far.

Recently, the U.S. Department of the Treasury expanded the government bond buyback limit to over $4 billion per operation, effectively pushing down Treasury yields and weighing on the U.S. Dollar Index (DXY). In addition, after the SEC passed the Crypto Asset Regulations to establish a registration exemption mechanism, compliance concerns for traditional financial institutions were resolved. This triggered another significant wave of large net inflows into U.S. spot ETFs, exceeding $1.1 billion in net inflows in just two days and accelerating Bitcoin's price advance.
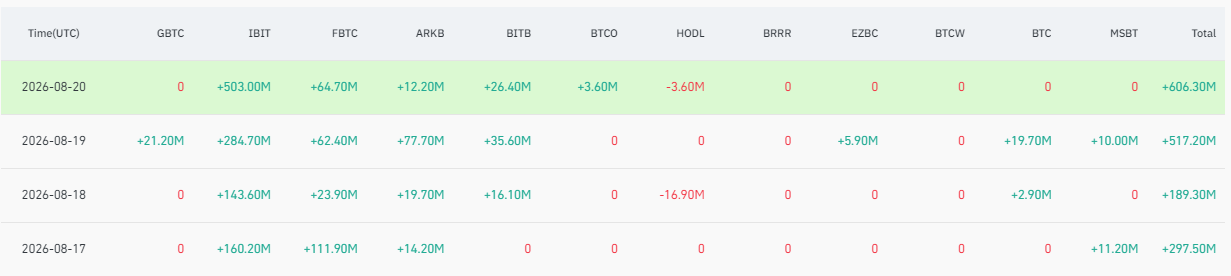
bitcoin-btc-etf-gbtc-c3b2a428516d4d0eb3f6e4c37075f4c2Bitcoin Spot ETF Fund Flows This Week, Source: Coinglass

Currently, Bitcoin prices have officially exited the previous liquidity wait-and-see phase, entering a strong primary upward trend driven jointly by spot demand and institutional capital. In addition, total short liquidations across the network spiked dramatically. Forced market-order liquidation buys combined with spot FOMO sentiment rapidly squeezed short liquidity, driving the price quickly past $77,000.
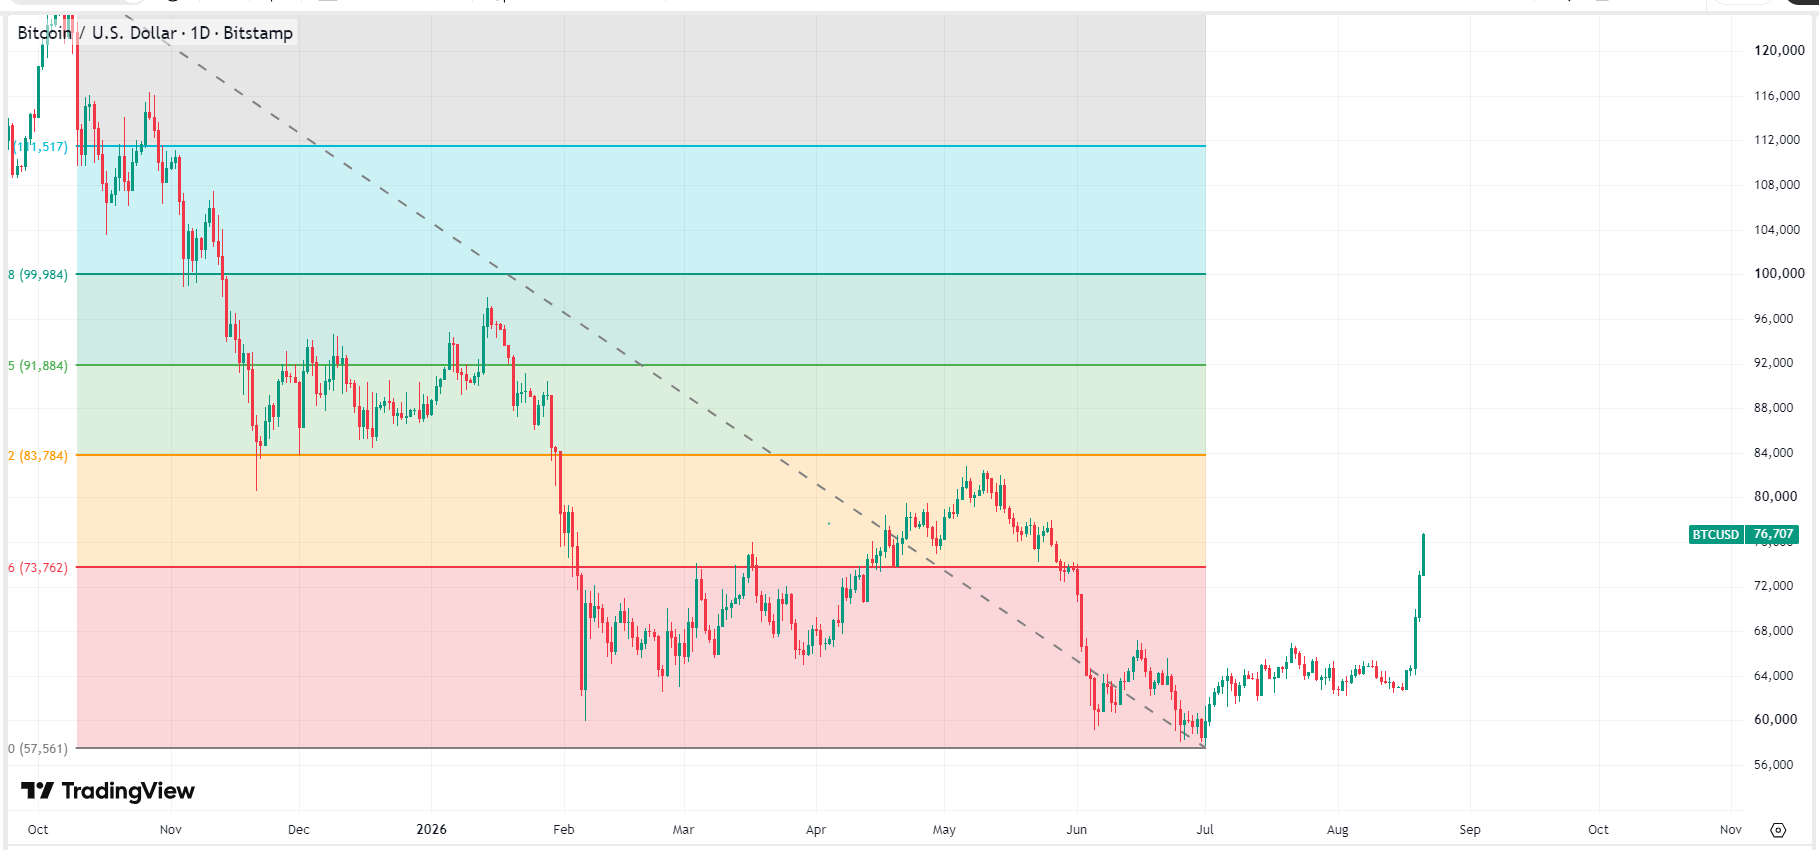
bitcoin-btc-price-5d3ef31594e04259810affbedc74b2c0Bitcoin Price Chart, Source: TradingView

Based on current market sentiment and BTC price action, after breaking through $77,000, structural overhead resistance from trapped positions has been largely absorbed. Technicals show strong price-volume concurrence, establishing a medium-term upward channel. According to CoinMarketCap data, today's Market Sentiment Index stands at 71, indicating that the market has entered a state of greed, though it has not yet reached extreme greed (above 80).

As long as the macroeconomic easing framework and spot ETF buying remain unchanged, after short-term consolidation and turnover, the market still possesses strong momentum to challenge $82,000. This marks the highest point of the rebound following this year's sell-off and lies near the 0.382 Fibonacci resistance level. However, investors should be mindful of short seller pushback around the $80,000 psychological level, which could trigger a brief, sharp pullback.

Disclaimer: For information purposes only. Past performance is not indicative of future results.
placeholder
XRP Price Prediction for July 2026: Can Buyers Finally Break the Downtrend?XRP (XRP) price trades near $1.05, caught between a year-long downtrend and a sudden burst of buying.July has historically rewarded XRP holders. This year the month arrives with on-chain accumulation
Author  Beincrypto
Jun 30, Tue
XRP (XRP) price trades near $1.05, caught between a year-long downtrend and a sudden burst of buying.July has historically rewarded XRP holders. This year the month arrives with on-chain accumulation
placeholder
XAUUSD Gold Analysis: Gold Holds Above $4,350 Ahead of US Inflation Data Is $4,500 Next? Gold holds above $4,350 following weak US jobs data. As inflation reports approach and UBS eyes $5,000, can XAUUSD break resistance at $4,435 to rally toward $4,500?
Author  Naoufal Seddik
Aug 12, Wed
Gold holds above $4,350 following weak US jobs data. As inflation reports approach and UBS eyes $5,000, can XAUUSD break resistance at $4,435 to rally toward $4,500?
placeholder
Gold Price Analysis Today: Gold Drops 1.32% Despite Lower Fed Rate-Hike Bets, Can $4,313 Support Hold? Gold fell 1.32% on August 13 after rising to $4,449.73, then reversing lower and closing near $4,349.918 below the $4,356.46 support. Softer US inflation data reduced Fed rate hike expectations, but selling pressure still dominated the session. Will $4,313 support hold?
Author  Naoufal Seddik
Aug 14, Fri
Gold fell 1.32% on August 13 after rising to $4,449.73, then reversing lower and closing near $4,349.918 below the $4,356.46 support. Softer US inflation data reduced Fed rate hike expectations, but selling pressure still dominated the session. Will $4,313 support hold?
placeholder
Gold Price Analysis Today: Gold Gains 0.94% as Markets Expect Fed to Hold Rates, Can $4,449 Resistance Break? Gold gained 0.94% on August 17, closing near $4,417.30 as softer US data strengthened expectations for unchanged Fed rates in September. Gold remains bullish, with $4,449.730 resistance and $4,310.650 support in focus.
Author  Naoufal Seddik
Aug 18, Tue
Gold gained 0.94% on August 17, closing near $4,417.30 as softer US data strengthened expectations for unchanged Fed rates in September. Gold remains bullish, with $4,449.730 resistance and $4,310.650 support in focus.
placeholder
Gold Price Analysis Today: Gold Rebounds After 1.91% Drop as Yields Ease. Is $4,449 Next? Gold fell about 1.91% on August 18 before producing a strong bullish reaction from the 1-hour demand zone in early August 19 trading. RSI is recovering from oversold conditions, but Supertrend remains bearish as traders await the Fed minutes.
Author  Naoufal Seddik
Aug 19, Wed
Gold fell about 1.91% on August 18 before producing a strong bullish reaction from the 1-hour demand zone in early August 19 trading. RSI is recovering from oversold conditions, but Supertrend remains bearish as traders await the Fed minutes.
goTop
quote