


The Bond Market Just Flashed a Rare Warning Seen Twice in 20 Years. History Says the Stock Market Will Do This Next.
Key Points
The 30-year Treasury bond yield recently soared to 5.31% (the highest level since June 2007) due to anxiety about corporate bonds, interest rate hikes, and national debt.
As of Aug. 19, the 30-year Treasury bond has maintained a yield of at least 5% for 32 consecutive trading days, the longest streak since the summer of 2007.
Last time the 30-year Treasury bond maintained at yield of at least 5% for 31 straight trading days, the S&P 500 and Nasdaq fell into correction during the subsequent year.
- 10 stocks we like better than S&P 500 Index ›
The U.S. stock market has posted solid returns this year despite battling economic uncertainty created by President Donald Trump's policies. Year to date, the broad-based S&P 500 (SNPINDEX: ^GSPC) index has advanced 12% and the technology-heavy Nasdaq Composite (NASDAQINDEX: ^IXIC) index has added 13%.
Despite strong corporate earnings in the first and second quarters, surveys conducted by the American Association of Individual Investors indicate that bearish sentiment has increased significantly since January. In particular, investors are anxious about inflation, government debt levels, and heavy spending on artificial intelligence.
Missed Nvidia in 2009? This Rare Signal Is Flashing Again. In 2009, a "Double Down" signal flashed for a little-known chipmaker called Nvidia. For the first time in years, that same "Total Conviction" signal is flashing for a company 1/100th the size of Nvidia. Continue »
The bond market, fueled by those concerns, just flashed a warning sign last seen about two decades ago. The 30-year Treasury bond yielded 5.31% when the market closed on Aug. 17, the most since June 2007. Last time 30-year Treasuries paid that much, the S&P 500 and Nasdaq Composite dropped into correction territory during the next year.
Here's what investors should know.
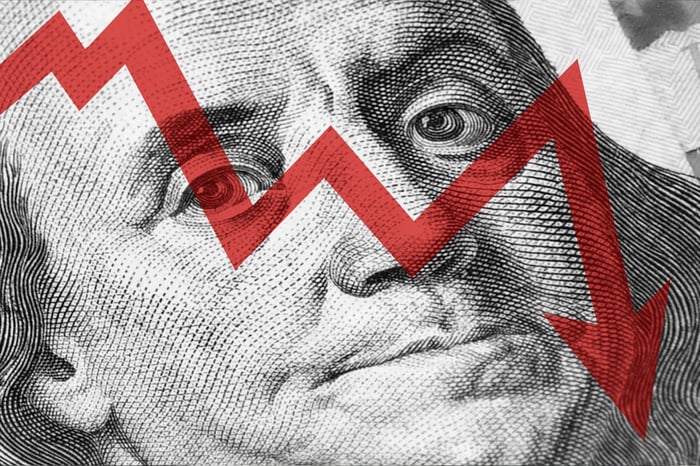
Image source: Getty Images.
Treasury yields are rising due to concerns about corporate bond supply, inflation, and national debt
Treasury bonds are debt securities issued by the U.S government. They pay interest semiannually until maturity, at which point the bondholder recoups the principal. Bond prices and yields move in opposite directions, and both figures are driven by market supply and demand.
In recent weeks, Treasury bonds have come under selling pressure (causing prices to drop and yields to rise) because investors are concerned about several things:
- Hyperscalers and neoclouds are funding investments in artificial intelligence infrastructure by issuing debt. The increase in corporate bond supply (especially from companies with strong cash flows) has reduced demand for Treasury bonds.
- Investors anticipate two quarter-point interest rate hikes from the Federal Reserve in the next year because inflation has remained above target for more than five years. The expectation that Treasury bonds will pay higher yields in the future is reducing demand today.
- U.S. national debt recently hit $40 trillion. The federal government will have to sell more bonds in the future, not only to cover annual deficits, but also to pay off older bonds. So investors want higher interest rates as compensation for lending to a government that is deeply indebted.
Collectively, those headwinds have driven Treasury bond prices lower (and yields higher), and similar moves in the past have been bad news for the stock market. Not only do higher interest rates suppress consumer spending and business investments, but they also make bonds look increasingly attractive relative to stocks.
History says the S&P 500 and Nasdaq Composite are headed for market correction territory
As mentioned earlier, the 30-year Treasury bond paid 5.31% when the market closed on Aug. 17, the most it's paid since June 2007. In fact, there have been only two trading days in the last 20 years when the 30-year Treasury bond paid 5.3% or more. What happened in June 2007? The U.S. stock market suffered a correction. The S&P 500 and Nasdaq Composite dropped 15% by March 2008.
Additionally, as of Aug. 19, the 30-year Treasury bond has maintained a yield of at least 5% for 32 straight trading days, the longest streak since the summer of 2007. What happened then? The U.S. stock market suffered a correction. The S&P 500 and Nasdaq Composite fell by 18% and 16%, respectively, over the next year.
In short, history says the recent surge in 30-year Treasury bond yields could draw money away from stocks, potentially dragging the S&P 500 and Nasdaq Composite into market correction territory. Past performance is never a guarantee of future results, but bonds look increasingly attractive relative to stocks as yields rise.
Should you buy stock in S&P 500 Index right now?
Before you buy stock in S&P 500 Index, consider this:
The Motley Fool Stock Advisor analyst team just identified what they believe are the 10 best stocks for investors to buy now… and S&P 500 Index wasn’t one of them. The 10 stocks that made the cut could produce monster returns in the coming years.
Consider when Netflix made this list on December 17, 2004... if you invested $1,000 at the time of our recommendation, you’d have $432,621!* Or when Nvidia made this list on April 15, 2005... if you invested $1,000 at the time of our recommendation, you’d have $1,335,314!*
Now, it’s worth noting Stock Advisor’s total average return is 973% — a market-crushing outperformance compared to 213% for the S&P 500. Don't miss the latest top 10 list, available with Stock Advisor, and join an investing community built by individual investors for individual investors.
See the 10 stocks »
*Stock Advisor returns as of August 21, 2026.
Trevor Jennewine has no position in any of the stocks mentioned. The Motley Fool has no position in any of the stocks mentioned. The Motley Fool has a disclosure policy.
Recommended Articles


