


Top Altcoins Price Forecast: Ripple rallies above $1, Solana eyes $85, Cardano eases gains
- Ripple hovers around $1.09 on Thursday, following a 10% jump the previous day as the broader crypto market rises.
- Solana remains capped below $85, as price edges marginally lower after a 10% jump on Wednesday.
- Cardano is down over 2% on Thursday, losing the 7% gains from the previous day.
Top altcoins, such as Ripple (XRP), Solana (SOL), and Cardano (ADA), are holding steady on Thursday after a bullish rebound as the broader crypto market rebounds on US Treasury bond buybacks. The technical outlook for XRP and SOL suggests further upside, while ADA risks losing the recent gains.
Technical outlook: Could XRP, SOL, and ADA regain bullish momentum?
Ripple trades around $1.0951 on Thursday, following a 10% surge the previous day. XRP maintains a near-term bullish bias above the 50-day Exponential Moving Average (EMA) at $1.0764 but remains capped below the 100-day and 200-day EMAs at $1.1539 and $1.3787, respectively.
Momentum is recovering on the daily chart, with the Moving Average Convergence Divergence (MACD) crossing above its signal line and the Relative Strength Index (RSI) at around 59, suggesting bullish momentum is improving.
XRP must reclaim the 100-day EMA at $1.1539, near the July 21 high of $1.1646, to extend its rally, potentially targeting the June 15 high at $1.2935.
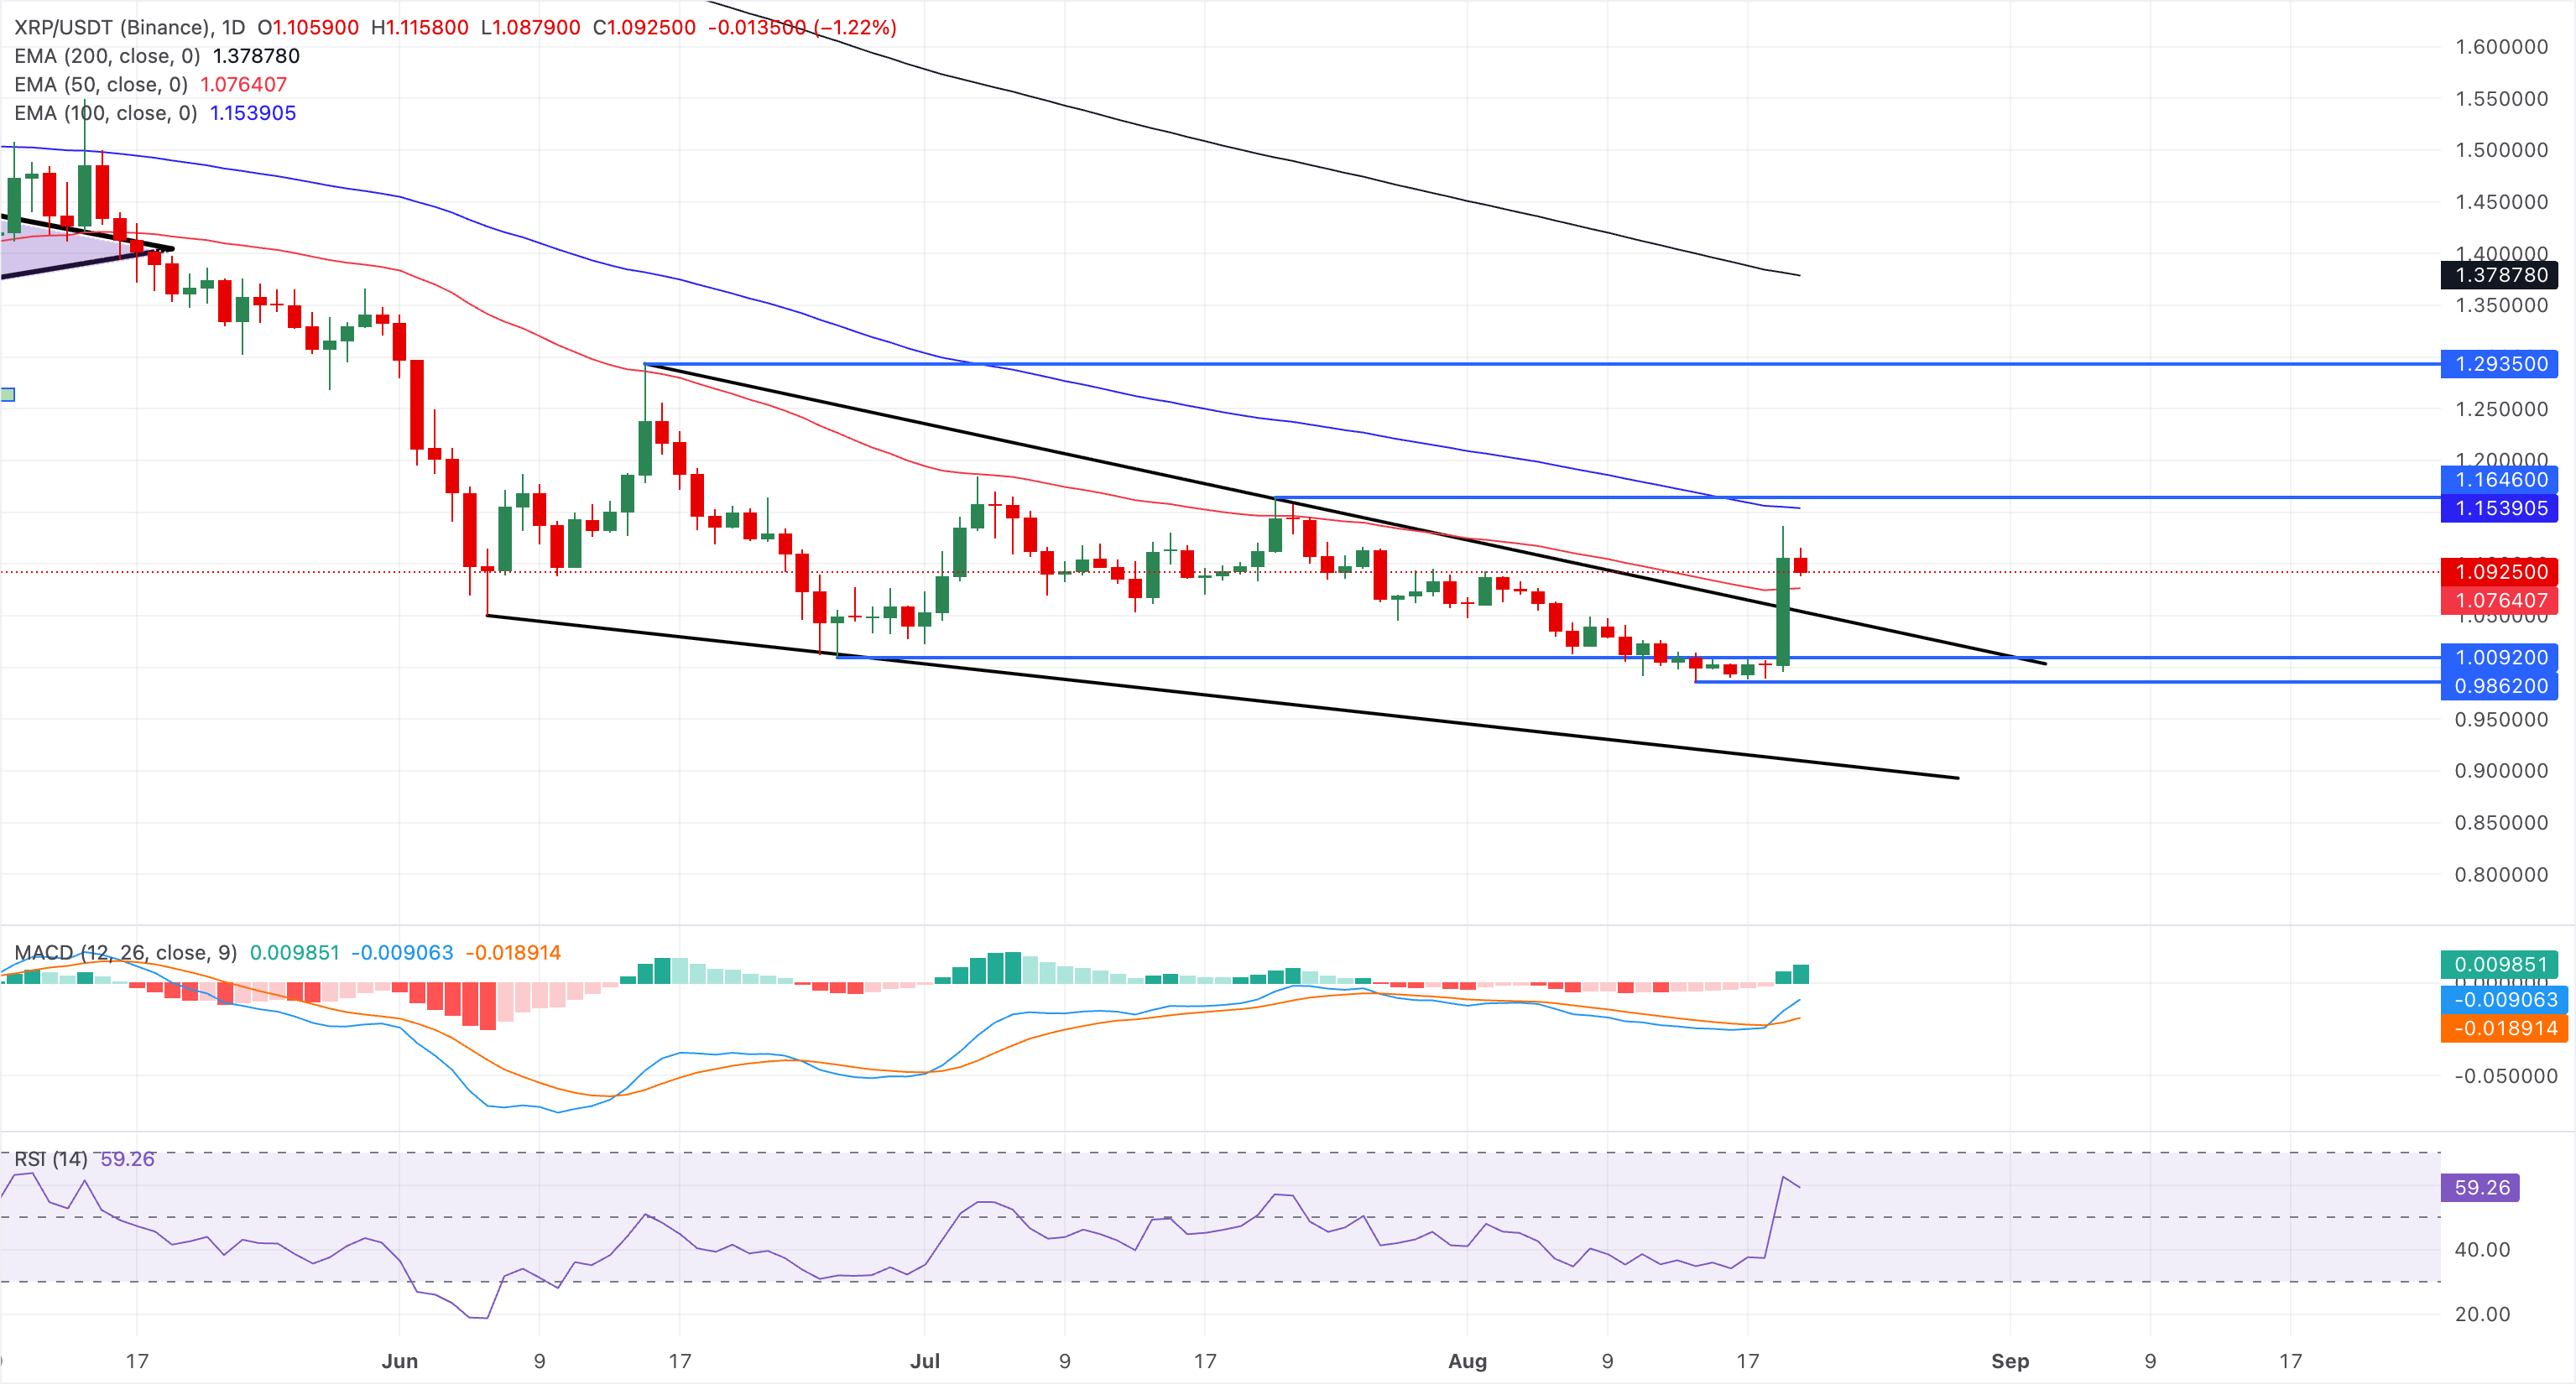
On the downside, initial support is at the 50-day EMA at $1.0764; a clear break below this floor would expose a deeper pullback toward the $1.00 psychological support.
Solana trades around $84.81, extending a bullish bias as price holds above the 50-day and 100-day EMAs at $76.30 and $78.41, respectively. SOL also holds above the 50% retracement of the $98.41 to $60.13 downswing at $79.27.
Momentum is strong, with the RSI hovering in overbought territory near 72 as buying pressure builds and the MACD shows a positive trend with its signal line, reaffirming persistent upside pressure.
Solana must surpass its 200-day EMA at $88.82, close to the 78.6% Fibonacci retracement at $90.21, to extend its rally toward the $98.41 swing high and the $100 psychological threshold.
On the downside, initial support is seen at the 50% retracement at $79.27 and the 100-day EMA at $78.41, while deeper pullbacks would expose the 50-day EMA at $76.30.
Cardano is down over 2% on Thursday, putting at risk its 7% rise from the previous day. ADA holds marginally above the 50-day EMA at $0.1799, suggesting a cautiously constructive near-term tone. However, the pair remains capped beneath the 100-day and 200-day EMAs at $0.1930 and $0.2597, respectively, reinforcing a broader corrective structure.
Momentum is mixed, with the RSI hovering around 52 in a neutral zone, and the MACD edging higher toward the signal line, hinting at easing bearish pressure.
Immediate support for Cardano is seen at the 50-day EMA clustered around $0.1799, with a deeper floor at the ascending support trendline region near $0.1651, where buyers would be expected to reassert themselves if the current advance stalls.
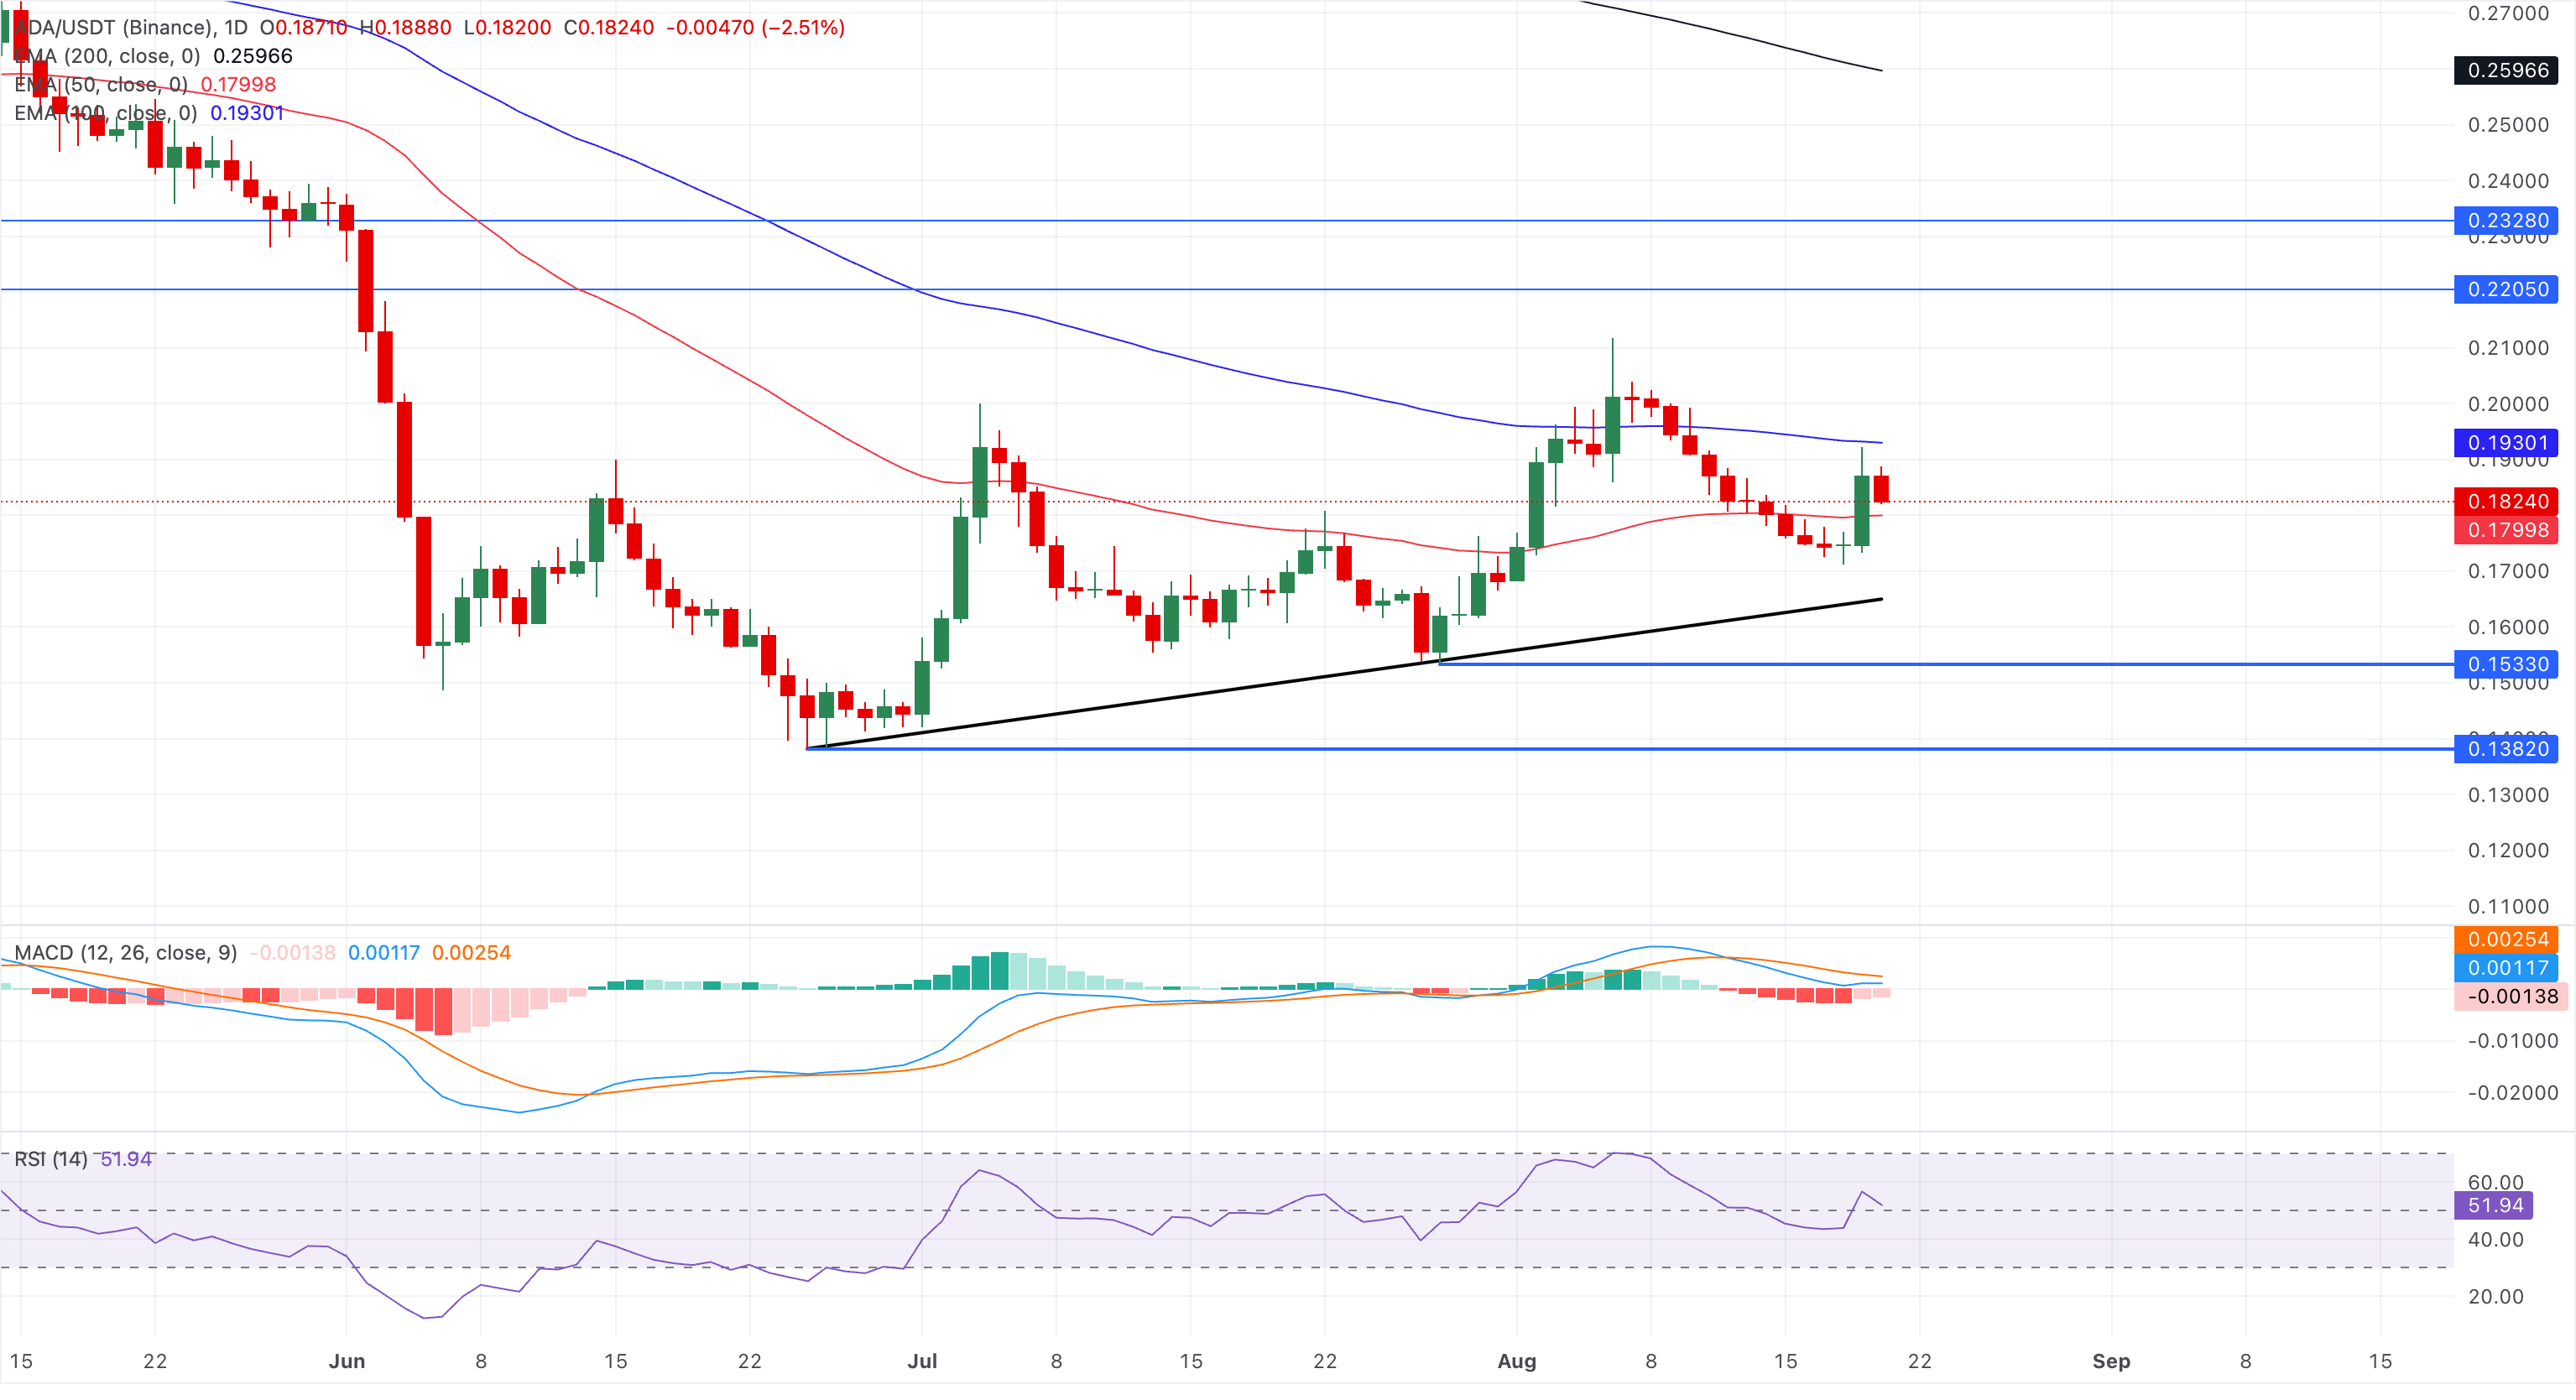
On the topside, initial resistance stands at the 100-day EMA at $0.1930, and only a decisive daily close above this barrier would open the way toward the more distant 200-day EMA at $0.2597, shifting the focus toward a more sustainable bullish recovery.
(The technical analysis of this story was written with the help of an AI tool. Know more.)
Recommended Articles


