


Ethereum Price Forecast: ETH holds steady below $1,900 as retail distribution rises
Ethereum price today: $1,860
- Ethereum retail investors distributed roughly 360K ETH over the past week.
- With geopolitical tensions and a modestly hawkish Fed, retail investors are potentially moving out of the market as prices approach their acquisition costs.
- ETH faces short-term resistance at the 20-day EMA.
Ethereum (ETH) continued trading flat on Tuesday following modestly increasing exchange net flows and continued distribution across retail wallets.
Ethereum on-chain data shows mixed sentiment across several wallet cohorts.
Wallets with a balance of 10K-100K ETH, also known as whales, acquired a net of 130K ETH over the past week, their first notable inflow in nearly three weeks.
While whales accumulated, retail wallets saw distributions. Wallets in the 1K-10K ETH bracket reduced their holdings by 230K ETH after holding firm in the past two weeks.
Similarly, investors with 100-1K ETH reduced their collective balance by roughly 130K ETH, extending their distribution trend, which has been consistent all through the year.
The move from both wallets represents a combined 360K ETH net outflows from retail wallets over the past week.
The Spent Output Profit Ratio (SOPR), which measures whether recently distributed tokens were moved at a profit or loss, provides a glimpse of the reason behind these retail distributions. The metric hovered between 0.98 and 1.01 over the past week, indicating most distributions during the period were done near break-even prices.
-1785890268289.png)
With geopolitical tensions continuing to hang over the financial markets and a modestly hawkish Federal Reserve (Fed), these retail investors are potentially moving out of the market as prices approached their acquisition costs, indicating continued cautious sentiment among the cohort.
Meanwhile, Exchange Net flow remains negative but has been rising over the past few weeks. The metric has risen from -34K ETH to -4K ETH since mid-July, indicating that bullish dominance on spot markets is easing but at a modest pace.
 - All Exchanges (19)-1785890298173.png)
The slow activity follows reports of the crypto market experiencing one of its weakest trading volumes since November 2023, indicating investors are hesitant to have a directional bias again.
In the near term, Net Realized Losses increased on Monday, meaning most coins moved since the beginning of the week were distributed at a loss.
On the institutional front, inflows remain low, with US spot ETH exchange-traded funds (ETFs) pulling in a net of $27.42 million last week.
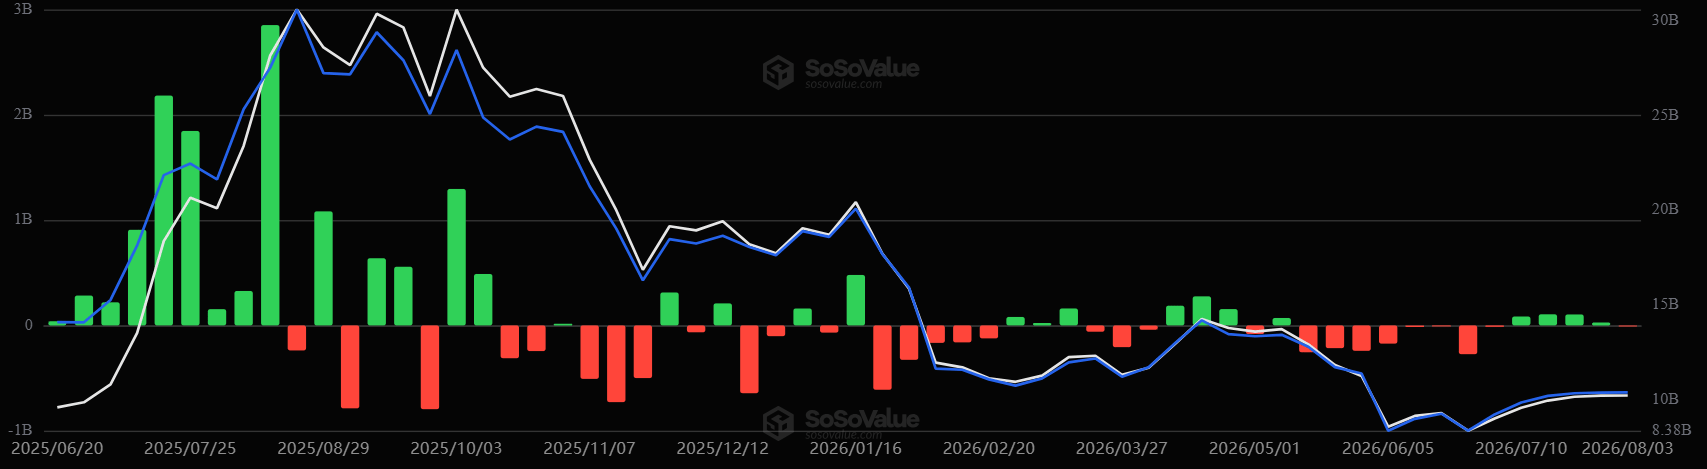
On Monday, the products returned to outflows, losing a net $11.42 million.
Ethereum Price Forecast: ETH faces resistance at 20-day EMA
Ethereum saw $17.77 million in liquidations over the past 24 hours, led by $11.77 million in short liquidations.
On the daily chart, ETH is holding a neutral near-term posture as prices sit between the tight 50- and 20-day Exponential Moving Averages (EMAs) at $1,851 and $1,869. The 100-day EMA at $1,931 and the previously broken rising trend-line now acting as resistance near $1,948 cap the topside, while the 14-day Relative Strength Index (RSI) around 51 and a Stochastic reading near 29 suggest momentum is consolidating after a pullback rather than trending decisively in either direction.
On the downside, immediate support appears at the 50-day EMA at $1,851, ahead of the horizontal floor at $1,809. A deeper decline would expose $1,701 and then $1,507.
On the topside, a daily close above the 20-day EMA at $1,869 would open the way toward the 100-day EMA at $1,931 and the trend-line barrier at $1,948. Stronger resistance is seen at $1,961, before $2,172 and $2,431 come back into focus.
(The technical analysis of this story was written with the help of an AI tool. Know more.)
Recommended Articles


