Solana Price Forecast: SOL nears key support zone as bears aim for a 20% downside

Source Fxstreet
  • Solana is down 3% on Wednesday, approaching its 50-day EMA at $76.67.
  • SOL ETFs recorded inflows of $1.67 million on Tuesday, down from $8.36 million on Monday, signaling mild institutional demand.
  • Retail demand for SOL is mixed, with fluctuating funding rates, while Open Interest dropped 4% over the last 24 hours.

Solana (SOL) price is down 3% on Wednesday, extending a bearish reversal after an overhead trendline capped the previous week’s recovery. Institutional inflows eased to $1.67 million on Tuesday, while declining Open Interest and fluctuating funding rates indicate mixed retail demand. The technical outlook for SOL indicates a bearish bias, with a risk of a decline of over 20% if price clears below the 50-day Exponential Moving Average (EMA) at $76.67.

Sellers regain strength as institutional buying eases

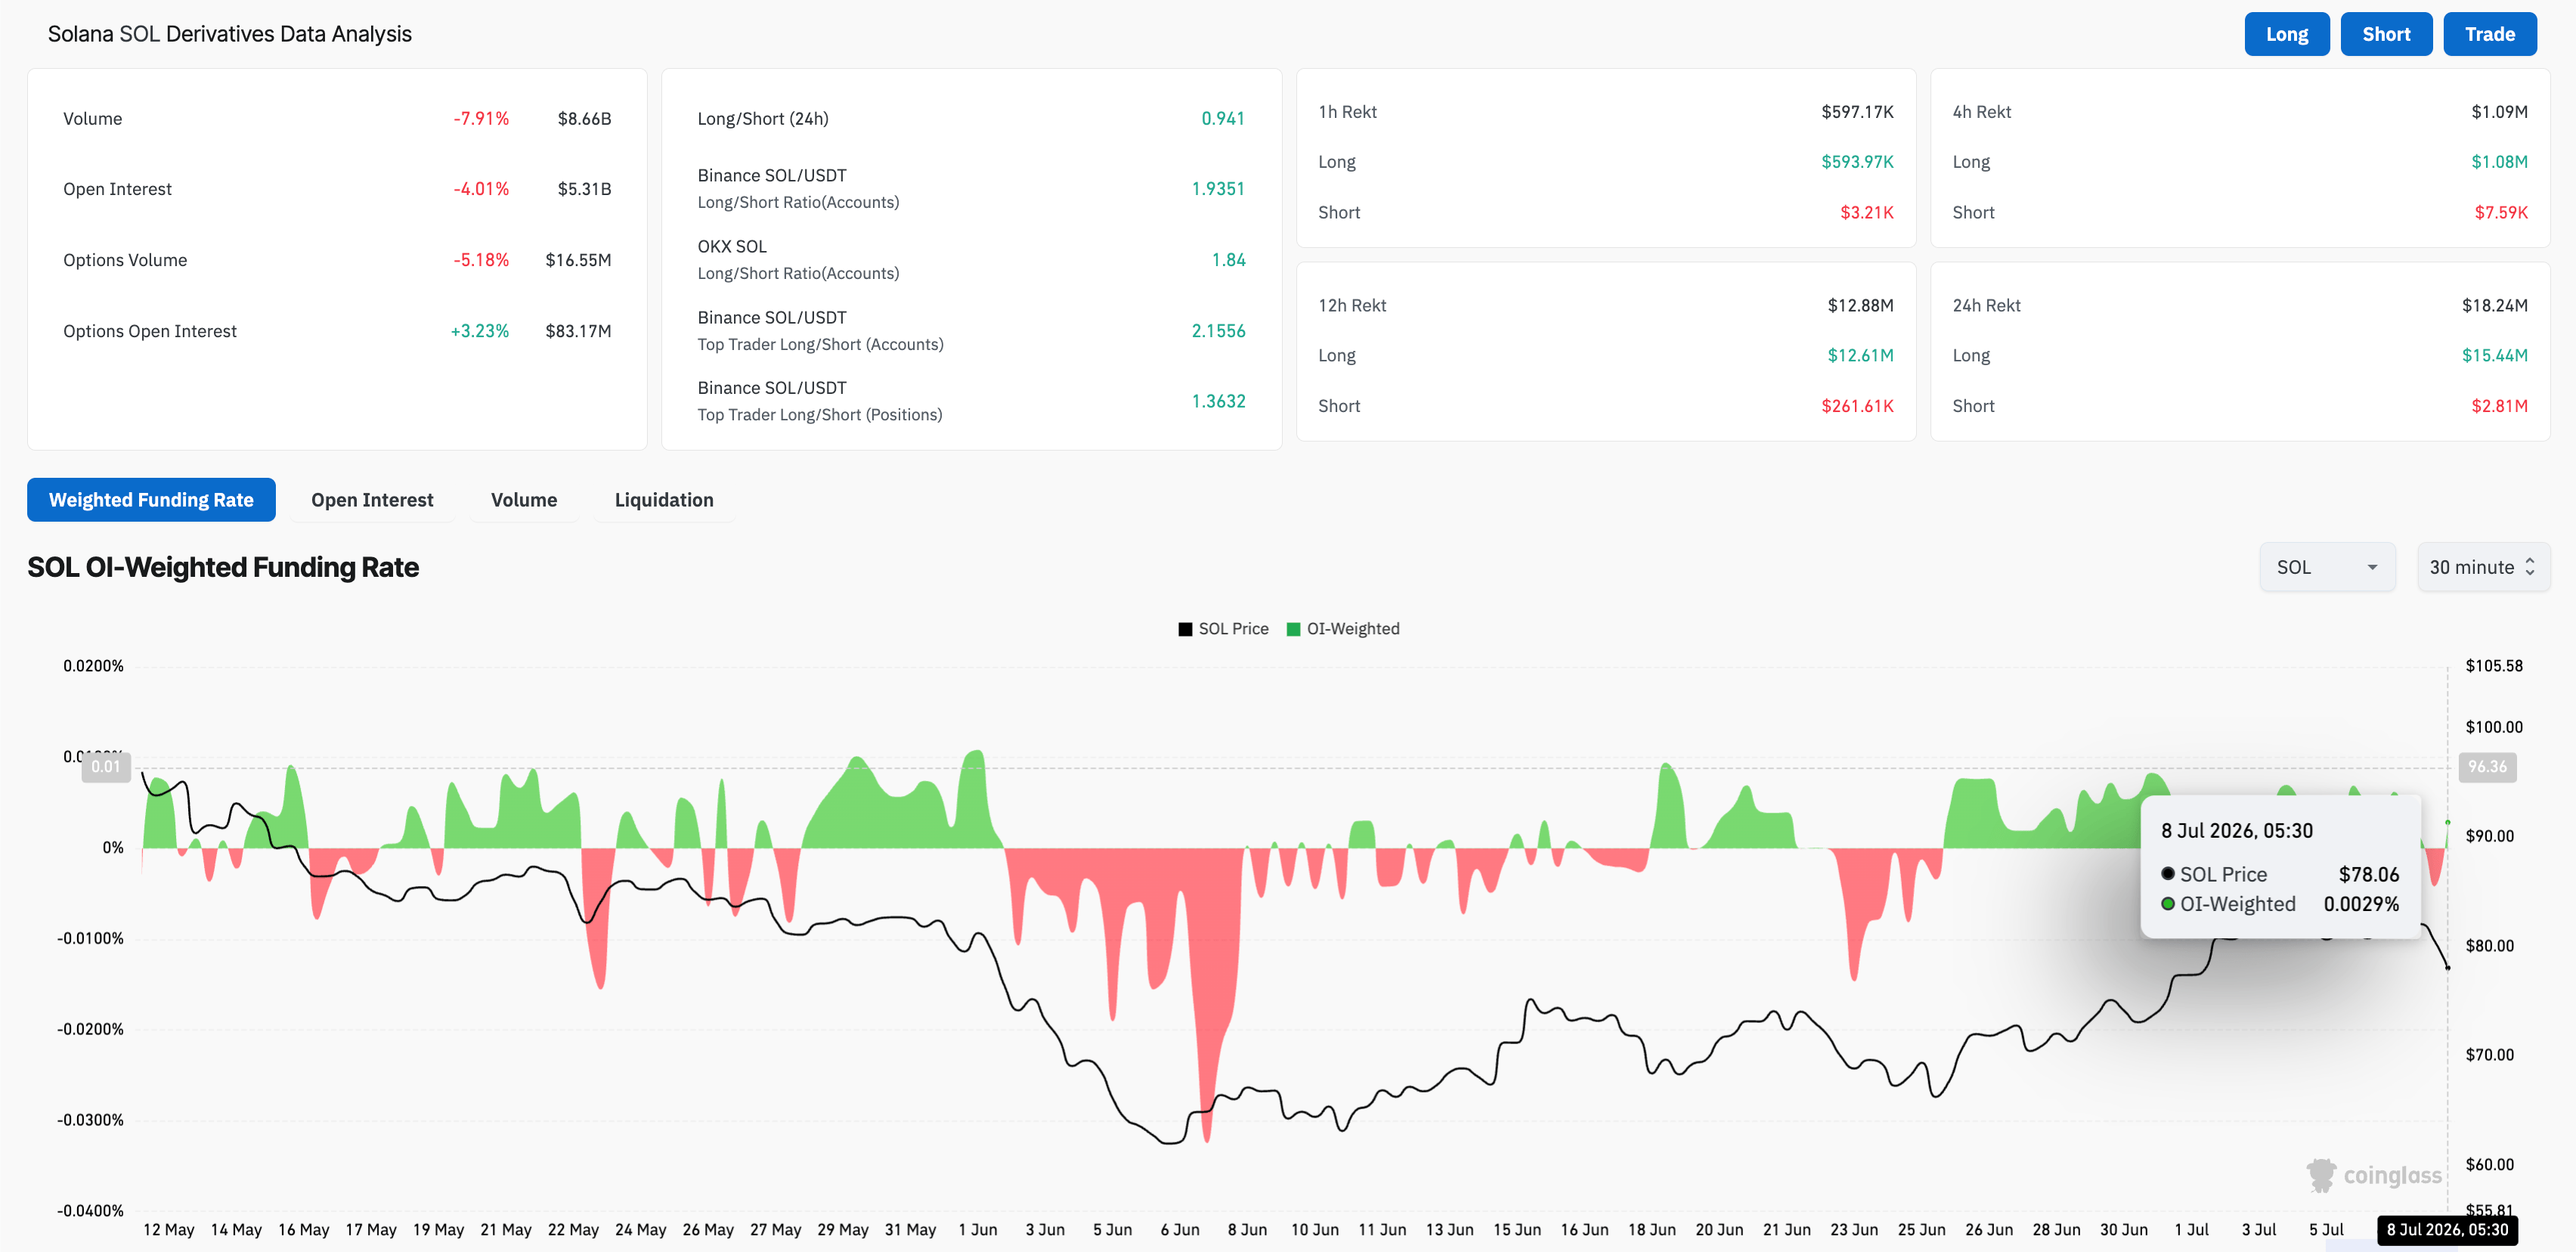
Solana is losing retail demand as broader market risk-off sentiment builds, while inflows into SOL-focused Exchange Traded Funds (ETFs) ease. CoinGlass data show SOL futures Open Interest (SOL) is down 4% in the last 24 hours to $5.31 billion, indicating a decline in open SOL contracts as risk-on sentiment eases among traders. At the same time, volume is down 8% to $8.66 billion, while funding rates stand at 0.0029%, up from -0.0042% the previous day, indicating near-term indecisiveness. 

On the institutional front, the SOL ETFs recorded inflows of $1.67 million on Tuesday, down from $8.36 million on Monday, signaling easing demand from institutional investors. 
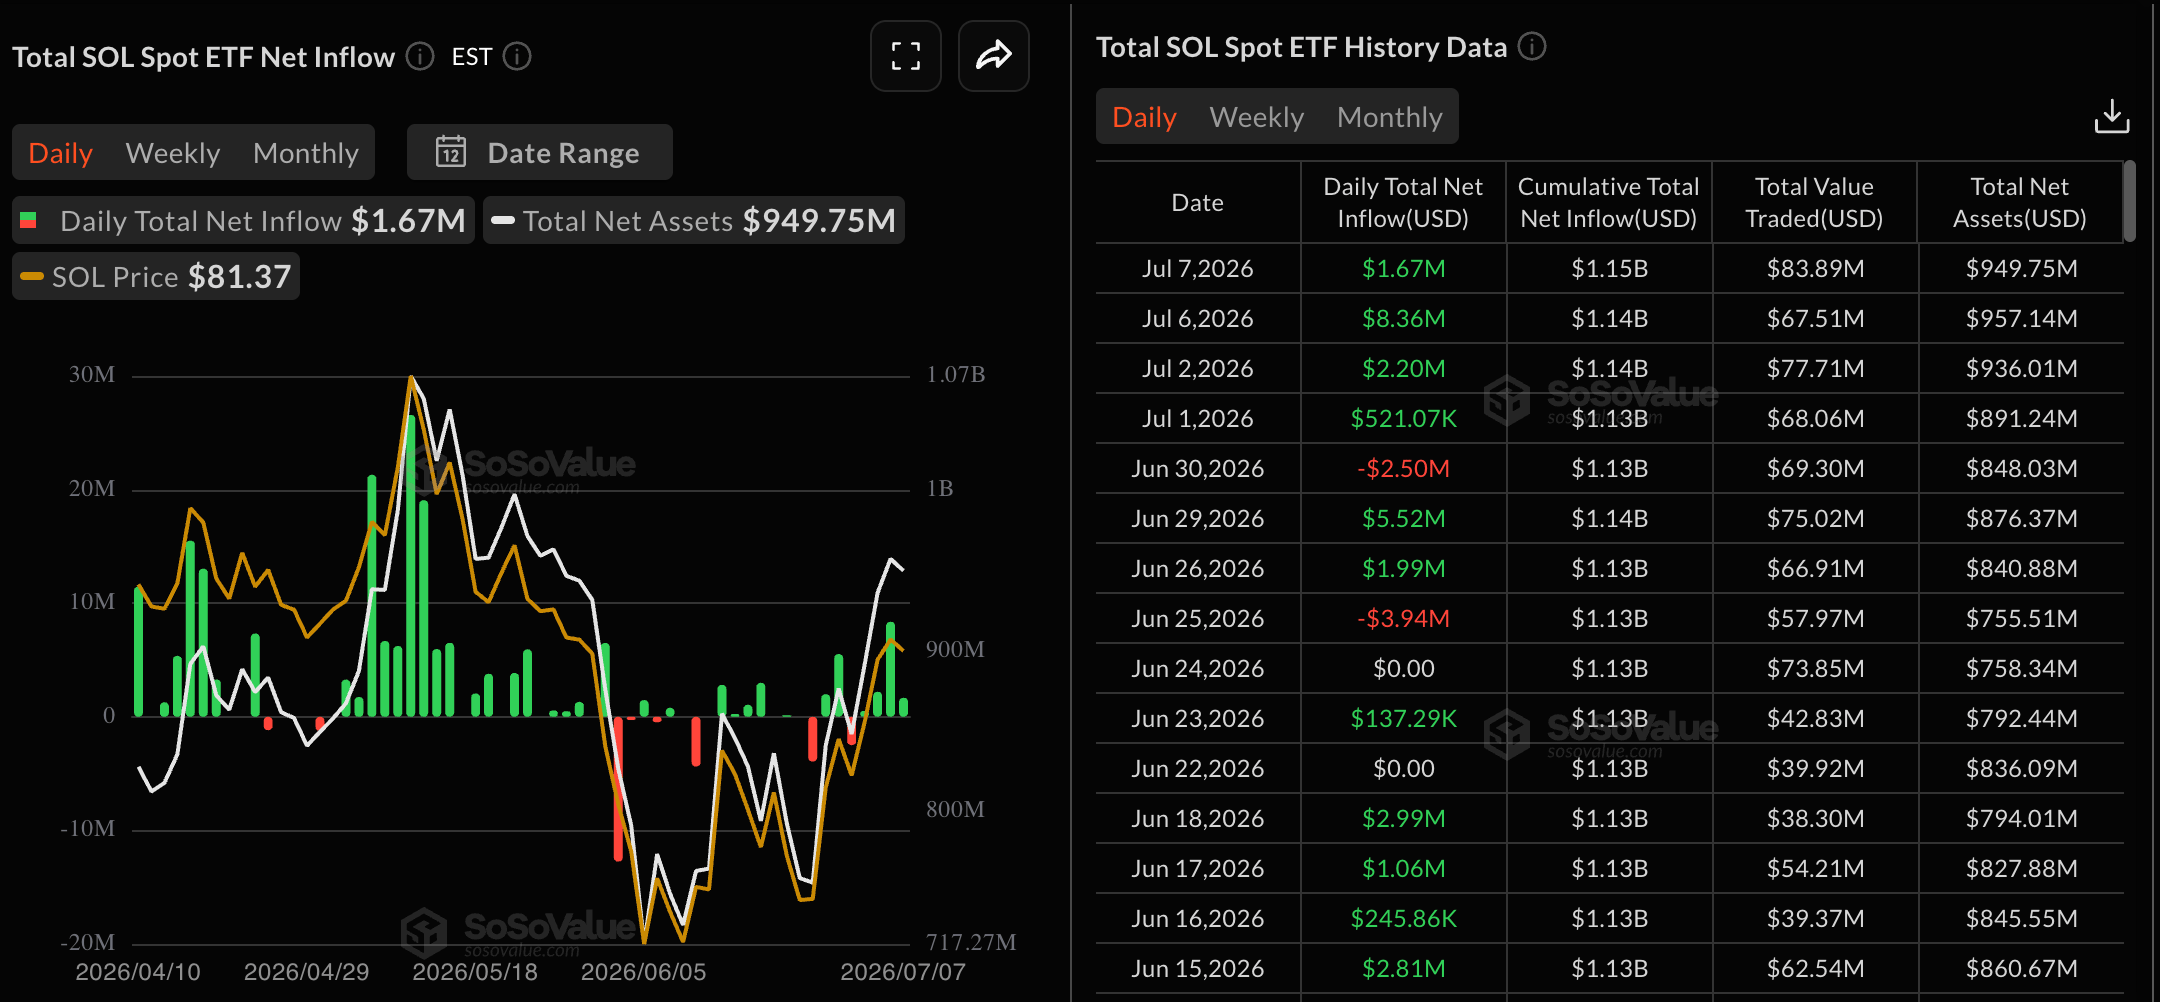
SOL ETFs data. Source: Sosovalue
SOL derivatives data. Source: CoinGlass

Solana risks a 20% drop below its 50-day EMA

Solana is down 3% on Wednesday, extending its decline from a long-term overhead trendline, which capped the previous week's recovery around $83.94. SOL remains capped well below the 200-day EMA at $95.51, which keeps the broader tone neutral rather than outright bullish

From a technical perspective, the 50-day EMA at $76.67, reinforced by the 50% retracement at $76.92, measured over the downswing from $98.41 to $60.13, serves as the immediate support zone for Solana. A decisive close below this zone could open the path toward the lower Fibonacci anchor at $60.13, indicating a downside of around 22%.

That said, the Moving Average Convergence Divergence (MACD) is descending toward its signal line, risking a bearish crossover as buying pressure wanes, while the Relative Strength Index (RSI) dips to 54 as buyers struggle to maintain momentum.

Chart Analysis SOL/USDT (Binance)
SOL/USDT daily price chart.

On the topside, initial resistance emerges at the downward resistance trendline at $83.94, where a sustained upmove would open the way toward the 200-day EMA at $95.51.

(The technical analysis of this story was written with the help of an AI tool. Know more.)

Disclaimer: For information purposes only. Past performance is not indicative of future results.
placeholder
XRP Price Prediction for July 2026: Can Buyers Finally Break the Downtrend?XRP (XRP) price trades near $1.05, caught between a year-long downtrend and a sudden burst of buying.July has historically rewarded XRP holders. This year the month arrives with on-chain accumulation
Author  Beincrypto
6 Month 30 Day Tue
XRP (XRP) price trades near $1.05, caught between a year-long downtrend and a sudden burst of buying.July has historically rewarded XRP holders. This year the month arrives with on-chain accumulation
placeholder
Smart Money is Leaving Nvidia for This AI Chip StockNvidia stock price keeps sliding, yet the usual dip buyers are missing. Institutional money flow on the stock is the most negative of any major chip name, which means big investors are stepping back i
Author  Beincrypto
6 Month 30 Day Tue
Nvidia stock price keeps sliding, yet the usual dip buyers are missing. Institutional money flow on the stock is the most negative of any major chip name, which means big investors are stepping back i
placeholder
What to Expect From Ethereum (ETH) in July 2026Ethereum (ETH) enters July 2026 trading near $1,570, close to multi-month lows, after recording its first run of three consecutive red quarterly candles in its history.On-chain data and price charts n
Author  Beincrypto
7 Month 01 Day Wed
Ethereum (ETH) enters July 2026 trading near $1,570, close to multi-month lows, after recording its first run of three consecutive red quarterly candles in its history.On-chain data and price charts n
placeholder
Brent Crude Oil Erases Entire War Premium, Falls 40% to Pre-War LevelsBrent crude oil has erased its entire war premium, sliding roughly 40% from its March peak near $120 to trade around $72.25 on Wednesday. The move returns oil to its pre-war support base.The retreat f
Author  Beincrypto
7 Month 02 Day Thu
Brent crude oil has erased its entire war premium, sliding roughly 40% from its March peak near $120 to trade around $72.25 on Wednesday. The move returns oil to its pre-war support base.The retreat f
placeholder
Meta Compute Launch Sends AI Compute Stocks Tumbling GloballyMeta’s plan to sell surplus computing power hit chip stocks hard on Wall Street. Meta’s own shares climbed nearly 9% on the news.The announcement flipped years of assumed AI compute scarcity into a su
Author  Beincrypto
7 Month 02 Day Thu
Meta’s plan to sell surplus computing power hit chip stocks hard on Wall Street. Meta’s own shares climbed nearly 9% on the news.The announcement flipped years of assumed AI compute scarcity into a su
Related Instrument
goTop
quote