


WTI (USOIL) Is up 2.18% on Aug 30: What Changed in Supply and Demand?
WTI (USOIL) is up 2.18% at Aug 30 18:10(ET), now at $84.899, with a 7-day down of 1.88%.
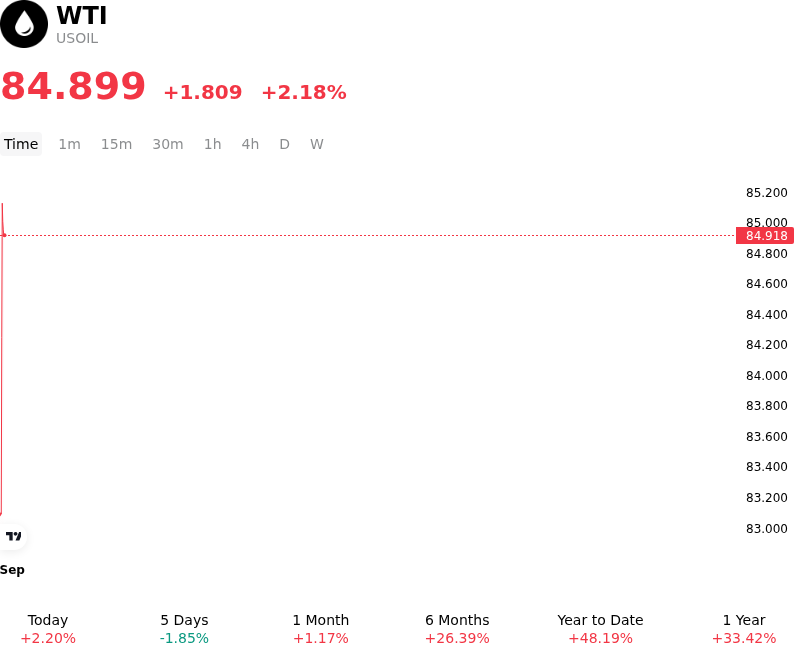
What is driving WTI (USOIL)’s stock price up today?
The advance in West Texas Intermediate crude futures was primarily catalyzed by renewed geopolitical supply friction in the Middle East alongside signs of tight physical market fundamentals. Heightened uncertainty surrounding critical maritime transit corridors, particularly around the Strait of Hormuz and Persian Gulf shipping lanes, led institutional participants to re-embed a geopolitical risk premium into front-month contracts. Additional friction surrounding international enforcement of oil trade sanctions further constrained global export availability, offsetting recent downside pressure from transient diplomatic headlines and prompting active short-covering across energy derivatives.
Physical supply dynamics provided robust underlying support to the price rebound. High refinery run rates in the United States, operating near seasonal capacity limits, maintained steady demand for domestic crude slates. The inventory backdrop remains structurally constrained by low levels in the U.S. Strategic Petroleum Reserve, which limits the buffer available to absorb unforeseen supply shocks. Although commercial crude stocks experienced minor week-on-week fluctuations, strong downstream product consumption, particularly in middle distillates and motor fuels, signaled sustained end-user demand across major consumer nations.
Macroeconomic conditions and shifts in institutional positioning further reinforced the upward trajectory. Broader commodity sentiment gained traction as expectations for central bank monetary easing supported global growth prospects, mitigating fears of an immediate cyclical demand slowdown. A stabilizing U.S. dollar provided additional momentum, rendering dollar-denominated crude contracts more attractive to international buyers. Systematic capital flows and technical buying were triggered as prices held key support levels near major moving averages, amplifying intraday upward momentum.
Looking forward, the price action reflects a recalibration of short-term market balance risks rather than an unconstrained structural trend. While geopolitical risk premiums and high refinery utilization continue to establish a firm price floor, market participants remain focused on potential OPEC+ supply policy adjustments and economic performance in key consuming regions. Investors continue to monitor upcoming weekly inventory reports, maritime export tracking data, and central bank interest rate trajectories to gauge the durability of current price levels.
Technical Analysis of WTI (USOIL)
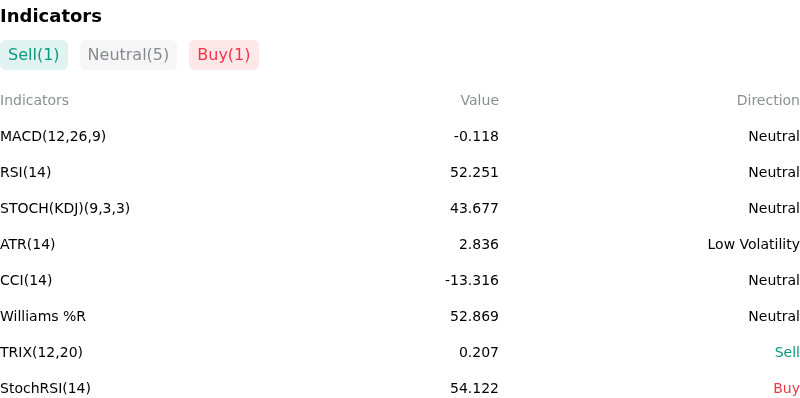
Technically, WTI (USOIL) shows a MACD (12,26,9) value of -0.118, indicating a neutral signal. The RSI at 52.251 suggests neutral condition and the Williams %R at 52.869 suggests neutral condition. Please monitor closely.
More details about WTI (USOIL)
Recent Events and Risks:
- Geopolitical Risk Premium Unwinding: Accelerated diplomatic discussions and reports of shipping corridor negotiations in the Middle East have rapidly unwound geopolitical risk premiums, triggering intraday selling pressure across WTI futures as immediate maritime transit disruption fears recede.
- Surge in U.S. Commercial Crude Inventories: Recent U.S. Energy Information Administration (EIA) data revealed a massive 17.4 million-barrel commercial crude inventory build—the largest weekly accumulation since January 2023—driven by a steep drop in U.S. crude exports and higher net imports.
- Sustained Chinese Demand Deterioration: Sharp reductions in Chinese crude imports, driven by lower refinery throughput, domestic fuel export restrictions, and expanding electric vehicle adoption, continue to act as a structural cap on crude prices and reinforce global demand weakness.
- Bearish Global Demand Forecasts and OPEC+ Supply Returns: Synchronized downgrades to global oil demand forecasts by the IEA and OPEC, alongside scheduled OPEC+ returns of voluntary supply cuts, are escalating market concerns over an impending physical market surplus.
Recommended Articles


